State of the Minnesota River 2000-2005 Surface Water Quality Monitoring
STATE OF THE MINNESOTA RIVERSUMMARY SURFACE WATER QUALITY MONITORING 2000-2005 Download a printable pdf version of the Fact Sheet (pdf 4,903 k) |
 |
||||||
|
Water Quality Monitoring |
|
||||||
| WATER QUALITY MONITORING | |||||||
 |
Monitoring results from 2000 to 2005 indicate that the water quality concerns in the Minnesota River Basin comprise three major categories: excessive sediment, nutrient enrichment and environmental health risks. Water quality data have been collected throughout the Minnesota River Basin during the past thirty years and studies have shown excessive nutrient and sediment concentrations. Large portions of the basin do not meet state water quality standards for bacteria, turbidity, dissolved oxygen, ammonia, and biota. Researchers have analyzed almost thirty years worth of water quality data from the Minnesota River at Jordan and Fort Snelling. Trend analyses indicate increasing nitrate-N concentrations in the last ten years. Decreasing trends in total suspended solids and total phosphorus were found over the entire period. |
||||||
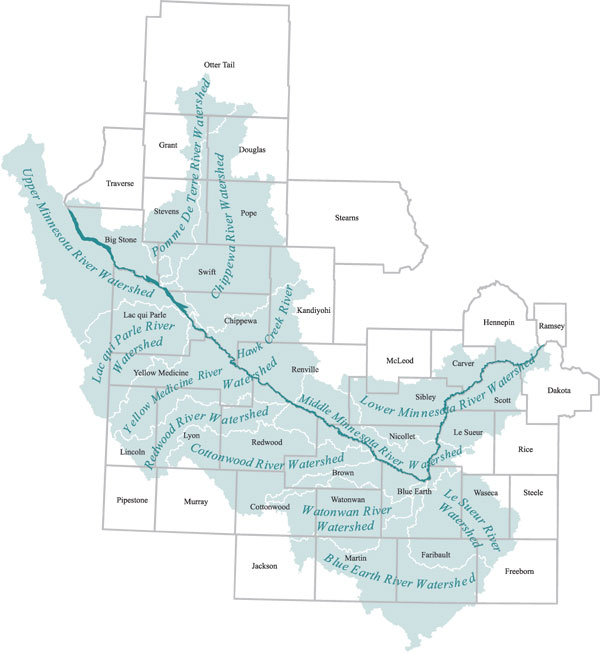
| The Minnesota River flows more than 335 miles from its source near the Minnesota-South Dakota border to its confluence with the Mississippi River at Minneapolis/St. Paul. It winds through diverse landscapes and drains nearly 20 percent of Minnesota. | |||||||
| EXCESSIVE SEDIMENT | |||||||
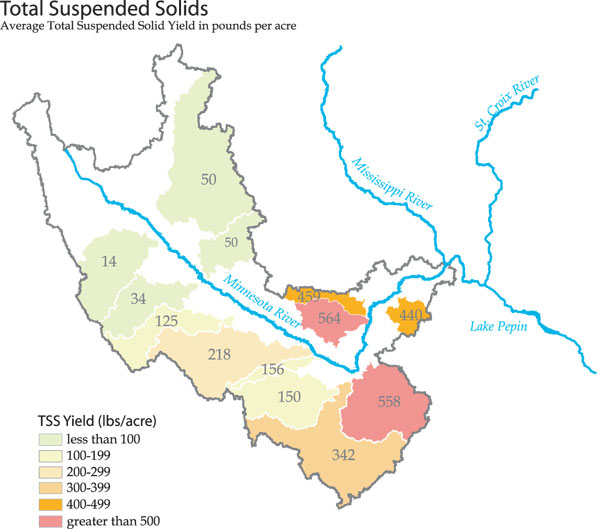 |
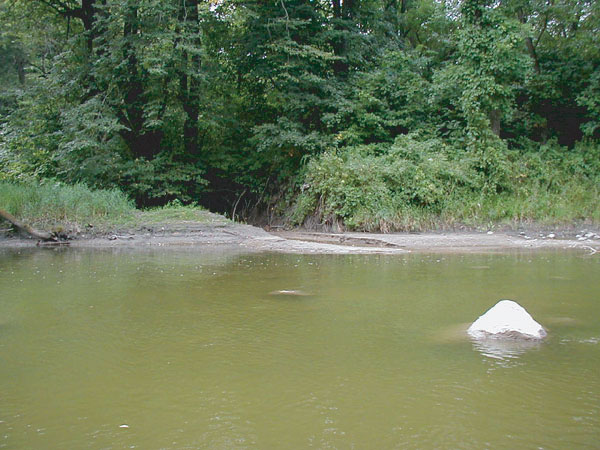
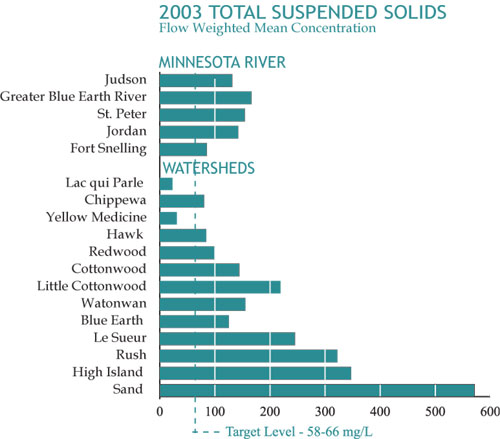
Excessive amounts of sediment degrade the ecological health and aesthetics of the Minnesota River and its tributaries. Turbidity refers to water clarity. The greater the amount of total suspended solids in the water, the murkier it appears and the higher the measured turbidity. This results in reduced light penetration that harms beneficial aquatic species and favors undesirable algae. An overabundance of algae further increases turbidity and compounds the problem. |
||||||
 |
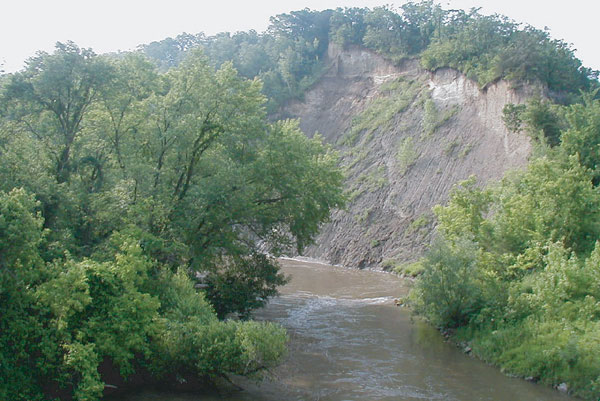
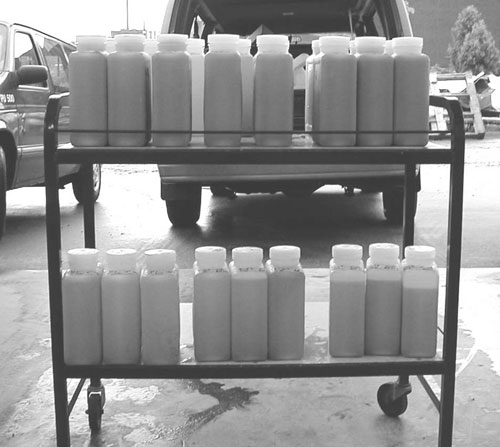
The photos at left show the dramatic increase in turbidity that often occurs when heavy rains fall on unprotected soils. Upon impact, raindrops dislodge soil particles while runoff waters easily transport fine particles of silt and clay across fields or through drainage systems to ditches and tributary streams throughout the Minnesota River Basin. Photo: Chetomba Creek, Hawk Creek Watershed |
||||||
 |
Streambanks and gullies also contribute sediment to the streams and rivers. | ||||||
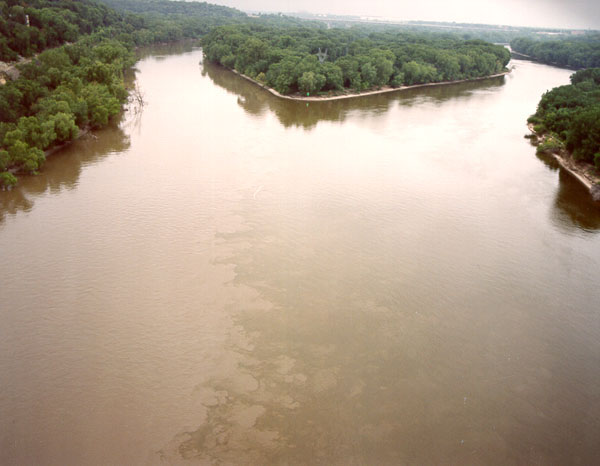 |
The sediment laden Minnesota River (left) flows into the Mississippi River (right). | ||||||
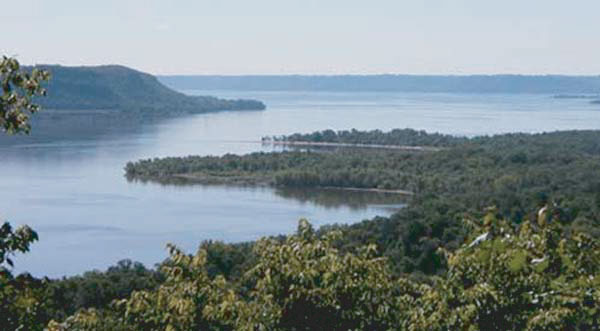 |
Sediment settles in Lake Pepin. Over 90 percent of Lake Pepin's sediment load is coming from the Minnesota River. The lake is filling in at 10 times its natural rate. | ||||||
| NUTRIENT ENRICHMENT: PHOSPHORUS | |||||||
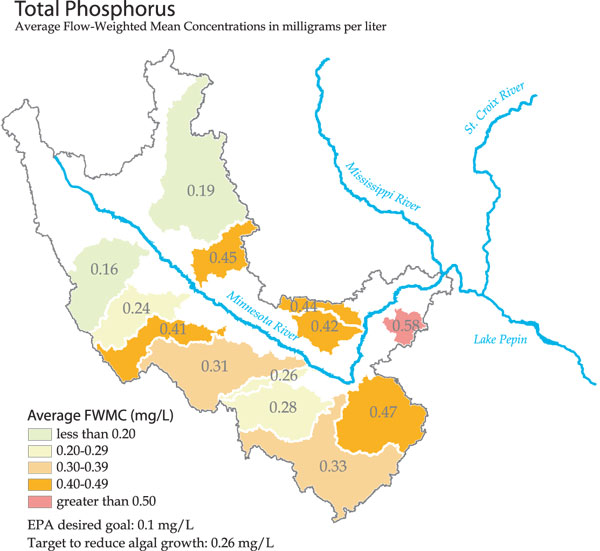 |
Phosphorus |
||||||
 |
Watonwan River algal bloom. | ||||||
 |
Blue Earth River algal bloom. | ||||||
 |
Lake Pepin algal bloom. The lake is accumulating phosphorus at 15 times the natural rate. | ||||||
| NUTRIENT ENRICHMENT: NITROGEN | |||||||
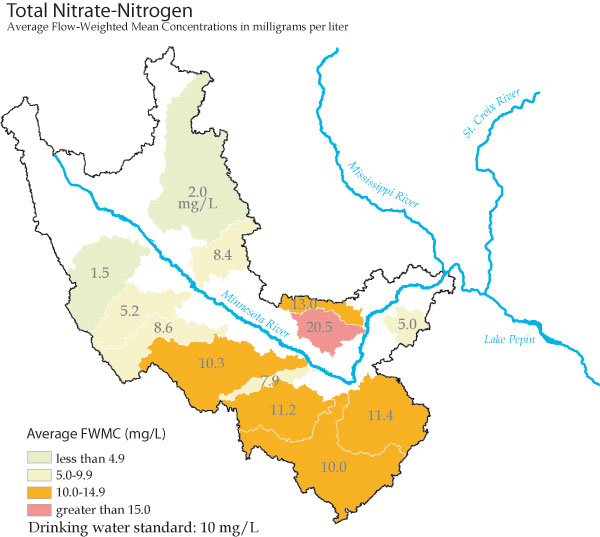 |
Nitrogen The predominant form of nitrogen in Minnesota River Basin streams is nitrate. Like phosphorus, nitrate can stimulate excessive levels of algal growth in streams. In recent years, this problem has been particularly severe in the Gulf of Mexico where development of a hypoxic zone (hypoxia means "low oxygen") has been linked to elevated nitrate levels carried to the Gulf by the Mississippi River. Reduced oxygen levels in the hypoxic zone, brought on by decomposition of algae, have damaged the shellfish industry and continue to threaten the aquatic ecosystem of the Gulf Region. The Minnesota River has been identified as a substantial contributor of excess nitrate to the Mississippi River and the Gulf Region. In addition to over-stimulation of algae, elevated levels of nitrate in drinking water can cause methemoglobinemia, or blue-baby syndrome. Nitrate concentrations vary substantially across the Minnesota River Basin. Nitrate levels are lowest in the western part of the Basin, elevated in the central part and greatest in agricultural watersheds in the most easterly part of the Basin. The watersheds shown in orange and red have concentrations that exceed the drinking water standard (10 mg/L). Most of the nitrate in the Minnesota River comes from agricultural drainage. |
||||||
 |
This image shows the hypoxic zone (sometimes referred to as the dead zone) in the Gulf of Mexico. Reds and orange indicate areas of low oxygen concentration. In July 2006, the hypoxic zone was mapped at 6,662 square miles -- similar to the size of Connecticut and Rhode Island combined. |
||||||
 |
|||||||
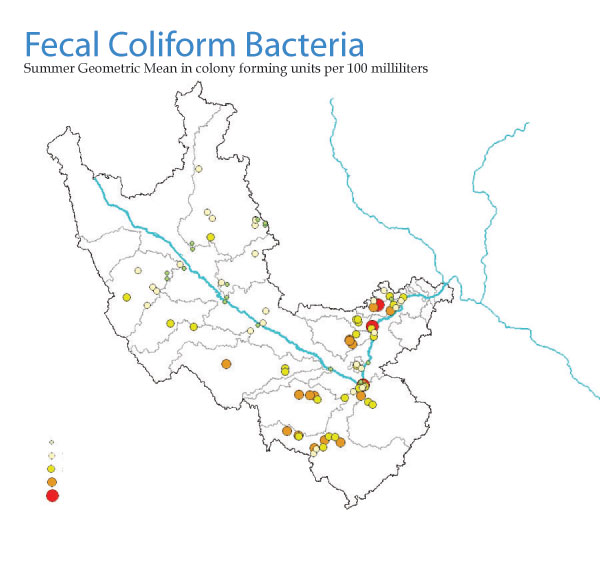
| ENVIRONMENTAL HEALTH | |||||||
| |
Nitrate in Drinking Water |
||||||
 |
|||||||
| For more information, visit the Minnesota River Basin Data Center website: http://mrbdc.mnsu.edu Research and photos courtesy of the Minnesota Pollution Control Agency, Metropolitan Council Environmental Services, Minnesota Department of Agriculture, and NOAA Great Lakes Environmental Research Laboratory. Produced by Minnesota State University, Mankato Water Resources Center - 12/06 |
|||||||
|
This page was last updated 9/07
|
|||||||