STATE OF THE MINNESOTA RIVER
EXECUTIVE SUMMARY
SURFACE WATER QUALITY MONITORING 2003
Access the full 2003 State of the Minnesota River Report
Download a printable version of the Executive Summary (pdf 1,234 k)
More on how to download and view pdf files
|
|
|
Basin Overview
Monitoring
Methods
Precipitation & Runoff
TSS
Phosphorus
Orthophosphorus
Nitrate-Nitrogen
Pesticides
Fecal Coliform Bacteria
What We Have Learned
Further Research
For More Information
|
|
| OVERVIEW |
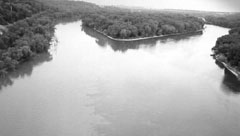 |
This executive summary provides an overview of the more detailed report entitled State of the Minnesota River: Summary of Surface Water Quality Monitoring 2003. The 2003 full report consolidates surface water quality monitoring information collected in the Minnesota River Basin for calendar years 2000-2003. The full report assembles data collected by multiple agencies and organizations and presents the data in a fashion that allows for relative comparison between the mainstem Minnesota River sites as well as the major and minor tributaries in the Minnesota River Basin. You can access the full report on the Minnesota River Basin Data Center website at http://mrbdc.mnsu.edu
|
| BASIN OVERVIEW |
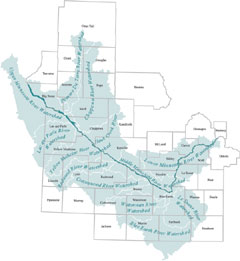 |
The Minnesota River originates at the Minnesota-South Dakota border, flows for 335 miles through some of the richest agricultural land in Minnesota and joins the Mississippi River at Minneapolis/St. Paul. The river drains a basin of 16,770 square miles: 14,840 square miles in Minnesota, including all or parts of 37 counties; 1,610 square miles in South Dakota; and 320 square miles in North Dakota and Iowa. Minnesota’s portion of the basin is primarily used for agriculture and represents 18.5% of the state’s land mass and 29% of its cultivated land. As the state’s largest tributary of the Mississippi River, the Minnesota River’s volume increases the Mississippi’s flow by 57% and adds disproportionately to its pollutant load.
The Minnesota River has been cited as one of the most polluted rivers in the state and nation. In response to these pronouncements, considerable attention and support have been given to clean up efforts. In recent years, there have been significant improvements in point source pollution control as well as continued adoption of conservation and best management practices within the Minnesota River Basin. With these changes has come an increasing expectation that the monitoring data being collected will or can be used not only to identify potential problem areas but also to quantify the impact of these changes on water quality. This collaborative effort will serve as a foundation for gauging progress toward a cleaner Minnesota River.
|
| MONITORING |
|
|
Monitoring History
State and federal agencies have collected water quality data at various locations and at various times throughout the Minnesota River Basin over the past thirty years. The most comprehensive study of water quality in the Minnesota River Basin, the 1994 Minnesota River Assessment Project (MRAP), concluded that the Minnesota River is impaired by excessive levels of nutrients and sediment. Since the MRAP report, several organizations throughout the Basin have taken responsibility for collecting additional data to better define tributary characteristics and learn more about how these tributaries affect the condition of the Minnesota River.
In many parts of the Basin, this information is used to target implementation practices that reduce nonpoint source pollution, thereby improving the overall health of the Minnesota River. Local watershed projects are supported by Clean Water Partnership grants administered by Minnesota Pollution Control Agency (MPCA). Much of the remaining data presented in this summary report is provided through monitoring programs of the Minnesota Department of Agriculture (MDA) and Metropolitan Council Environmental Services (MCES), with contributions from the United States Geological Survey (USGS), Minnesota Department of Natural Resources (MDNR) and the Minnesota State Climatology Office. See list of contributors on the back page.
MonitoringLocations
The data presented in this report was gathered at 32 surface water quality monitoring stations located throughout the Minnesota River Basin. Monitoring site locations for 2003 are illustrated on pages 1 and 2. In the full report, these sites are organized and reported according to mainstem, major tributaries and minor tributaries. Four sites are located on the Minnesota River mainstem, fourteen are located near the outlets of major tributaries (those with watersheds greater than 100,000 acres), and fourteen are located on minor tributaries (those with watersheds less than 100,000 acres). Organizing the sites in this manner allows comparisons of the data between streams and rivers of similar size.
Monitoring Season
Monitoring season length is an important variable to consider when characterizing water quality and evaluating trends throughout the Minnesota River Basin. For 2003, monitoring season length was April 1–September 30. While October flows can be substantial during some years, the April 1st (or ice out) through September 30th period typically captures the months when nutrient and sediment loads are expected to be the highest, and when the majority of river flow occurs.
Monitoring Focus
This monitoring summary focuses on the primary nonpoint pollutants of concern in the Basin—excessive sediment, phosphorus, orthophosphorus, nitrate-nitrogen, pesticide and bacteria concentrations. In accordance with the Clean Water Act, the Minnesota Pollution Control Agency (MPCA) lists rivers and creeks within the Basin that have been designated as “impaired waters” due to pollution problems such as low dissolved oxygen, mercury, PCBs, fecal coliform, turbidity, and excess ammonia. For an overview of the impaired waters program, visit MPCA’s website (http://www.pca.state.mn.us/water/tmdl/index.html). The Department of Health tracks PCB and mercury levels in fish and issues site specific fish consumption advisories (http://www.health.state.mn.us/divs/eh/fish/index.html).
|
| METHODS |
 |
Methods
Two primary methods of storm event sampling are used by projects in the Basin. Grab sampling is the collection of a discrete individual sample, either by manual means or with an autosampler. Flow-based composite sampling is the collection of a composite sample over all or part of a storm event, using an autosampler. The full report details the type of sampling methods at each site. Because this report is a joint venture of many agencies and organizations, water quality data collection efforts and data processing methodologies vary somewhat. Organizations involved in the preparation of this report are moving toward a standard set of methods, a step that will further improve the accuracy of water quality comparisons across the Basin. In the process of developing this report, specific monitoring criteria were developed that will guide monitoring organizations towards common methodologies (see full report).
Concentrations & Loads
The full report employs and explains many calculations used to describe water quality such as load, yield, and concentration. This executive summary focuses on two of these calculations—flow-weighted mean concentration (FWMC) and load. FWMC is calculated by dividing the total load (mass) for the given time period by the total flow or volume. It refers to the concentration (mg/L) of a particular pollutant taking into account the volume of water passing a sampling station over the entire sampling season. Conceptually, a FWMC would be the same as routing all the flow that passed a monitoring site during a specific timeframe into a big, well-mixed pool, and collecting and analyzing one sample from the pool to give the average concentration. A load is the estimate of pollutant total amount (mass), passing a specific location on a river during a specified interval of time.
|
| PRECIPITATION & RUNOFF |
|
Precipitation
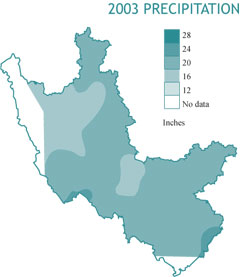
Across the basin, the amount of precipitation varies geographically, seasonally, and from year to year. In general, the eastern portion of the basin receives more rain than the western portion.
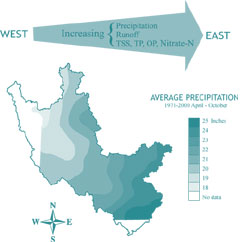
The 2003 total precipitation map (at right) illustrates that overall totals increase as one moves eastward through the Basin. Total precipitation amounts ranged from 16 inches in the western part of the Basin to 24 inches in portions of the eastern. The general pattern is consistent with long-term rainfall distribution in the Minnesota River Basin.
Runoff
Typically, the more precipitation that occurs in a watershed, the more runoff there will be (see runoff definition below). However, timing and intensity of precipitation, antecedent soil moisture conditions, soil types, land slope, land use, as well as other factors, can dramatically influence seasonal or annual runoff numbers. Due to geographical differences in precipitation, runoff tends to increase as one moves eastward across the Basin.
Runoff during the 2003 monitoring season varied from approximately one-half inch to six inches. Watersheds in the western portion of the Basin exhibited lower runoff and those in the eastern portion of the Basin exhibited higher runoff.
Evaluating runoff allows for a relative comparison of the amount of water coming out of different watersheds or portions of the basin. Higher runoff generally results in higher pollutant loads for most nonpoint source pollutants.
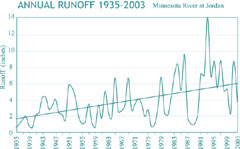
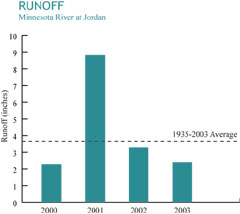
The annual runoff graph (lower right) illustrates the trend of increasing runoff volume over the past several decades. Highly variable runoff from one monitoring season to another highlights the need for an on-going program that collects, analyzes, and reports on surface water quality monitoring data.
|
| TOTAL SUSPENDED SOLIDS (TSS) |
 |
Total Suspended solids (TSS)
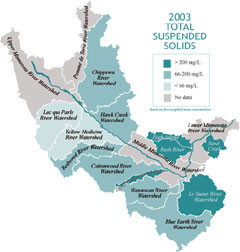
Total suspended solids are a major water quality concern in the Minnesota River Basin (see box below). Soils in the Basin have a high silt and clay content. Eighty-six percent of the suspended sediment in the Basin is characterized by fine particles of silt and clay that are easily transported in water. The Minnesota River carries more suspended sediment than most of the State’s rivers. Excess sediment degrades the river system by filling reservoirs, destroying aquatic habitats, altering biotic communities, increasing water treatment costs, and reducing the river’s aesthetic qualities.
Criteria/Standard
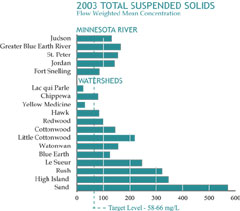
Minnesota does not currently have a water quality standard for total suspended solids (TSS) but does have a turbidity standard of 25 nephelometric turbidity units (NTUs). MPCA studies have shown a strong relationship between TSS and turbidity and have determined that TSS can be used as a surrogate to assess water quality conditions required by the Clean Water Act. In the Western Corn Belt Plains and Northern Glaciated Plains ecoregions, which encompass the majority of the Basin, surrogate TSS thresholds of 58 and 66 mg/L, respectively, can now be used for listing impaired waters when sufficient turbidity data are lacking.
2003 Findings
For the major tributaries, substantial differences in TSS flow-weighted mean concentrations are apparent across the Minnesota River Basin with concentrations seldom exceeding 100 mg/L in major tributaries in the upper part of the Basin. In contrast, concentrations in major tributaries in the lower part of the Basin frequently are much greater than 100 mg/L.
In general, TSS loads at mainstem sites during 2003 were among the lowest measured since reporting began in 2000.
Despite reduced TSS loads during 2003, mainstem flow-weighted mean TSS concentrations ranged from 85 mg/L in the Minnesota River at Ft. Snelling to 166 mg/L in the Greater Blue Earth River at Rapidan. These values exceed the turbidity-based thresholds of 58-66 mg/L.
Overall, 2003 marked a year when TSS loads and FWMC’s were moderate compared to values recorded at many sites during 2000 and 2001.
|
| PHOSPHORUS |
 |
Phosphorus
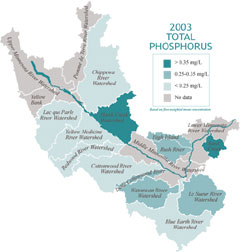
Phosphorus originates from many sources in the Minnesota River Basin and is the primary cause of algal growth, a leading contributor to low dissolved oxygen concentrations in the lower twenty-two mile reach of the Minnesota River during low flow conditions (see box below). Elevated phosphorus concentrations during low flow often indicate point sources, whereas elevated concentrations that occur mainly during higher flow periods can indicate nonpoint sources. The average condition of the Minnesota River mainstem appears to be a FWMC of approximately 0.35 mg/L. This elevated phosphorus level is one of the main reasons the Minnesota River is considered one of the most polluted rivers in the state. Controlling phosphorus is an important part of protecting the river.
Criteria/Standard
Currently, there are no statewide standards for total phosphorus (TP) in rivers or streams. The US Environmental Protection Agency (EPA) states a desired goal of 0.10 mg/L for prevention of nuisance plant growth in streams. An analysis of algal productivity and TP concentration data for the Minnesota River has shown that algal productivity will not start to diminish until TP concentrations fall below approximately 0.26 mg/L. Based on this information, the Minnesota River mainstem will continue to experience undesirable levels of algal growth until TP concentrations are reduced to below this level.
2003 Findings
The load of TP transported through the lower reach of the mainstem (St. Peter to Fort Snelling) during 2003 was the lowest amount recorded during the four-year reporting period.
In 2003, TP FWMC in the Greater Blue Earth River and the mainstem at Judson were diminished relative to 2001 levels and presently are at or near the 0.26 mg/L threshold value.
Total phosphorus FWMC values at the mouth of the Minnesota River mainstem dropped below the threshold during 2003.
Fewer high-intensity rainfall events during 2003 and generally reduced runoff throughout the Basin during both 2002 and 2003 probably account for most of the reduction in TP concentrations, but the data also may reflect basin wide efforts to reduce both point and non-point source phosphorus inputs.
During 2003, TP FWMC values in eight of the major tributaries were reduced from levels measured during 2002. This year, the Yellow Medicine River TP FWMC was 0.09 mg/L meeting, on average, the EPA desired goal of 0.10 mg/L TP set to prevent excess vegetative aquatic growth in rivers.
|
| ORTHOPHOSPHORUS |

|
Orthophosphorus
Orthophosphorus (OP) is a soluable form of phosphorus that is readily available to algae (bioavailable), and under certain conditions exerts an immediate impact on the growth of algae that can lead to subsequent reductions in dissolved oxygen as the algae dies and decays. Because of its bioavailability, when present at elevated concentrations, OP is of particular concern for lakes and streams. Generally, a larger proportion of the phosphorus in overland runoff from cropland is attached to sediment particles, and may not be immediately available to support algae growth. Studies in other regions have shown that 20-70 percent of particulate phosphorus is bioavailable. Sources of OP include wastewater treatment plants, feedlot runoff and failing septic systems.
Total phosphorus, by contrast, is a measure of the total concentration of phosphorus present in a water sample and includes phosphorus bound to sediment and organic matter (particulate phosphorus) which may not be immediately available for biological uptake. The availability of phosphorus in streams, soils, and sediment changes in response to a variety of environmental conditions.
2003 Findings
Orthophosphorus loads at mainstem sites declined during 2003 compared to 2002 and were substantially reduced compared to loads during 2001, a year of spring flooding.
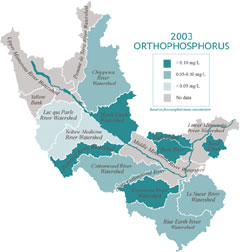
Orthophosphorus FWMC values during 2003 were mostly uniform at mainstem sites and the Greater Blue Earth River with a narrow range of at 0.06-0.08 mg/L.
In contrast, Orthophosphorus FWMC data for the major tributaries show substantial differences between rivers, with values that ranged from 0.02-0.20 mg/L during 2003, a ten-fold difference.
Six of the major tributaries, Hawk Creek, Redwood River, Watonwan River, Rush River, High Island Creek, and Sand Creek, had OP FWMC’s that exceeded the mainstem levels. As such, they have the potential to elevate OP concentrations in the mainstem. Five of those tributaries had OP:TP ratios greater than 40 percent compared to about 20-30 percent in the other major tributaries. These differences in the proportion of OP may be indicators of differences in the source of phosphorus loading. Wastewater from municipalities and septic systems, for example, usually has a high OP:TP ratio.
|
| NITRATE-N |

|
Nitrate-Nitrogen (Nitrate-N)
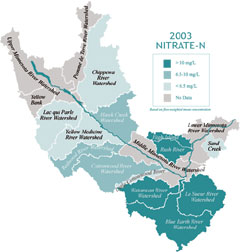
Nitrate-nitrogen loading from the Minnesota River Basin has local and national implications. Nitrate-N is important because it is biologically available to aquatic plants and is a major contributor to the nutrient enrichment of surface waters. Elevated nitrate concentrations in the river systems also have the potential to impact drinking water supplies (see box). Downstream, nitrate-N is the primary chemical contributing to the area of low dissolved oxygen, or hypoxia zone, at the mouth of the Mississippi River in the Gulf of Mexico. Elevated nitrate-N FWMC at Fort Snelling indicates substantial nitrate enrichment that likely contributes to the hypoxia zone.
Criteria/Standard
Nitrate-N concentrations in drinking water supplies are a public health issue. The standard for drinking water is 10 mg/L. Average ecoregion values for minimally impacted rivers in the Minnesota River Basin can be applied for nitrate-N concentrations. Ecoregions are areas with similar physical landscape characteristics. The ecoregion target includes nitrate-N concentrations in the 0.9 - 6.5 mg/L range.
2003 Findings
Nitrate-N loads declined during 2003 in the Minnesota River at Judson when compared to 2002 levels. However, nitrate-N loads increased in the Greater Blue Earth River Basin (Blue Earth, Watonwan, and Le Sueur Rivers). Research in recent years has shown that the amount of nitrate reaching streams is strongly associated with the amount of water that infiltrates and percolates through the soil profile.
Among mainstem sites, the Greater Blue Earth (GBE) River stands out with the greatest FWMC values for nitrate-N.
The GBE River comprises 22 percent of the total drainage area of the Minnesota River at Jordan but contributed 68 (2000), 48 (2001), 36 (2002), and 55 (2003) percent of the total nitrate-N load at Jordan.
Runoff in the GBE River increased 21 percent during 2003 compared to 2002, while nitrate-N loading increased 54 percent, demonstrating how nitrate-N loading can respond to a moderate increase in runoff.
|
| PESTICIDES |
 |
Pesticides
The Minnesota Department of Agriculture (MDA) is the lead state agency for most aspects of pesticide and fertilizer environmental and regulatory functions. To better understand pesticide use in Minnesota, the MDA conducts surveys designed to get a better understanding of existing farm practices regarding agricultural inputs such as fertilizers, manures and pesticides. The surveys find that corn and soybean acreage accounts for the majority of pesticide applications statewide. Pesticides are applied to over 95% of the major crops in surveyed areas. (For more information about the studies, see the MDA website http://www.mda.state.mn.us/appd/pesticides/pesticideuse.htm).
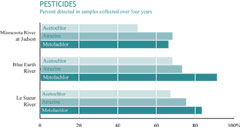
The MDA Monitoring and Assessment Unit collected pesticide samples from the Le Sueur River at Highway 66, the Blue Earth River below the Rapidan Dam, and the Minnesota River at Judson. During the four-year period (2000-2003), the herbicides metolachlor, atrazine and acetochlor were the most frequently detected compounds in these rivers. These herbicides are typically applied to corn/soybean rotations for general weed control.
2003 Findings
From 2000-2003, metolachlor was the most commonly detected pesticide with detections in approximately 80 percent of the surface water samples collected. During this same four year period, the herbicides atrazine and acetochlor were detected in 72 and 62 percent of the samples, respectively.
Pesticide concentrations for most compounds typically peak in May and June in the rivers of south central Minnesota, although it is not unusual to see peak metolachlor concentrations earlier in the year (March or April) because the product is commonly applied in the fall. Peak concentration periods generally occur with the first significant post-application runoff event.
Annual pesticide loads for the three most frequently detected pesticides were down significantly in 2003. However, loads for individual compounds were not consistently lower in 2003.
|
| FECAL COLIFORM BACTERIA |
 |
Fecal Coliform Bacteria
Fecal coliform bacteria are passed through the fecal excrement of humans, livestock and wildlife. These bacteria can enter streams and ditches through direct discharge of waste from mammals and birds, from agricultural and storm runoff, and from poorly or untreated human sewage. Individual septic systems can become overloaded during the wet periods enabling untreated human waste to enter ditches and streams. Septic systems classified as “Imminent Public Health Threats” can discharge untreated effluent directly to surface waters and can be a significant source during low flow conditions. Agricultural practices such as spreading manure during wet periods and allowing livestock uncontrolled access to streams can contribute to high levels of fecal coliform bacteria. Wildlife can also be a fecal coliform bacteria contributor, especially during low flow conditions.
Criteria/Standard
The Minnesota surface water standard for fecal coliform bacteria, listed below, apply to class 2b and 2c waters, the classification of almost all streams and ditches in the Minnesota River Basin. This standard applies only between April 1st and October 31st. The criteria are based on an assumed illness rate of 8 swimmers per 1,000 swimmers.
1. The geometric mean, based on not less than five samples within a 30-day period, shall not exceed 200 fecal coliform organisms per 100 milliliters of water; and
2. Not more than ten percent of all samples taken in any calendar month can exceed 2,000 organisms per 100 milliliters.
2003 Findings
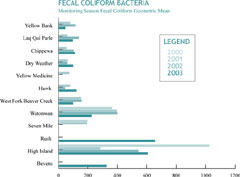
In the Minnesota River Basin, streams monitored for fecal coliform bacteria are often found to exceed water quality standards.
The majority of sites with adequate monitoring data were impaired by fecal coliform bacteria. However, several of the eastern watersheds have substantially higher bacterial concentrations than watersheds in the western part of the Basin.
Review of individual stream data in the Blue Earth, Watonwan, Le Sueur and Lower Minnesota River Watersheds show fecal coliform bacteria levels that were a magnitude of two to four times higher than western watersheds.
As stream order (size) increases, fecal coliform concentrations generally decrease. Suggested possibilities are dieoff of bacteria, deposition of sediment (with associated bacteria), and dilution with downstream water that may have lower fecal coliform concentrations.
What are Fecal Coliform Bacteria?
Fecal coliform bacteria are found in the intestines of warm-blooded animals. Fecal coliform bacteria are usually not harmful, but do indicate that disease-causing pathogens or disease-producing bacteria could be present.
In addition to bacteria and other pathogens, human and animal waste contain high levels of other pollutants such as phosphorus, nitrogen, and oxygen-demanding organic material. Additionally, some of the same processes (e.g. storm event runoff) and pathways (e.g. gullies) that lead to high suspended sediment concentrations in streams and rivers also contribute to human and animal waste entering the water.
|
| WHAT WE HAVE LEARNED |
|
|
The 2003 State of the Minnesota River: Summary of Surface
Water Quality Monitoring full report marks the fourth year that comprehensive monitoring efforts have been compiled in a single report. With this data, we are starting to be able to see trends and draw some conclusions.
A Degraded System
Concentrations of TSS, TP, OP and nitrate-N in several of the monitored streams are frequently at problematic levels. Affected streams range in size from minor tributaries to the Minnesota River mainstem. Concentrations of these pollutants are often at, or well above, thresholds associated with reasonable expectations for water quality in their respective ecoregions. The data clearly show that these impaired conditions develop during various hydrologic cycles ranging from near drought to floods.
Importance of Runoff
There was a remarkable difference between the four years with respect to runoff in the Basin. While 2000 was relatively dry in most of the Basin, 2001, a flood year, showed runoff values two to ten times greater than 2000. The results obtained during the past four years of monitoring continue to illustrate the strong influence that runoff exerts on the amount of sediment delivered to the Minnesota River. For example, sediment yield in the Greater Blue Earth River ranged from 126 lbs/acre during 2002 to 718 lbs/acre during 2001.
Magnitude and timing of individual runoff events also greatly affect the amount of sediment delivered. Whereas precipitation amounts and timing cannot be controlled, management alternatives that maximize water infiltration and retention and minimize soil erosion and surface runoff can be controlled and need to be aggressively promoted for reducing sediment delivery. This is especially true in the spring and early summer before crops are established.
Year-toYear Fluctuations
Data in this report illustrate widely varying water quality conditions in most streams during a relatively short four-year monitoring period. These year-to-year fluctuations underscore the value of long-term data gathering using consistent and technically sound methodology at all sites across the Minnesota River Basin. Such data, collected longer term, will form a solid body of evidence that more accurately portrays stream water quality. These data will enhance the impaired waters listing process by providing an improved perspective of stream water quality during normal, above normal, and below normal runoff periods.
Pollutants Increase in west-to-east Pattern
Data in this report show that watershed yields of key water quality pollutants (TSS, TP, OP and nitrate-N) follow a general pattern of increasing yield, often accompanied by increasing FWMC values, from west-to-east across the Minnesota River Basin. A corresponding west-to-east precipitation and runoff gradient has long been recognized and documented. The magnitude of the pollutant yield response, however, appears to be greater than what would be expected from the differences in annual runoff alone.
Rain Event Timing and Seasonality
The magnitude, frequency, intensity, duration, and seasonal timing of precipitation events can greatly affect pollutant yield, but other factors also may shape the observed responses. These factors may include differences in watershed geomorphology, vegetative cover, climate, and land use. In addition, direct human influences such as cropping, urbanization, extent and coverage of conservation practices, fertilizer usage (amount and timing), and point source inputs are all factors of pollutant yield. The relative importance of these, and perhaps other factors, needs to be better understood as we chart a course of action to reduce pollutant levels in streams, large and small, across the Minnesota River Basin.
Regional Differences
Monitoring data indicate regional differences in the magnitude of pollutant load response to water runoff. Differences may be related to watershed soils, geology, and stream morphology, but land use, cropping practices, drainage practices, and conservation practices also may be affecting load response. A better understanding of these processes could help allocate BMP resources more effectively.
|
| FUTURE RESEARCH NEEDS |
| |
Most people want to know if water quality in the Minnesota River Basin is improving. Unfortunately, this seemingly simple question is difficult to answer. As we have seen, seasonal and annual fluctuations and geographic differences make this a complex question. Long term and specially focused studies are key to understanding the health of the rivers in the Minnesota River Basin. The following observations suggest directions for future studies and on-going water quality research. For specific guidance on objectives and strategies to restore the Minnesota River Basin, refer to the Minnesota River Basin Plan published on the MPCA website (http://www.pca.state.mn.us).
Smaller Watershed Studies
Source mobilization and transport mechanisms that deliver pollutants to streams is a topic that needs further study. Several of the organizations that contributed data for this report are collecting additional data from smaller watersheds and are using that information to identify and target specific sources and areas within their respective watersheds.
Inclusion of data from some of these smaller watersheds in this year’s 2003 State of the Minnesota River: Summary of Surface Water Quality Monitoring full report, is providing a more comprehensive assessment and will improve our understanding of pollutant source and transport mechanisms. Some of the more complex pollutant source mobilization and transport mechanisms will likely need in-depth focused research studies beyond the scope of the present monitoring program. Some research of this type currently is in progress and more research is proposed. Better communication between researchers and continued coordination of the monitoring effort will improve our understanding of the processes and enhance our ability to reduce pollutant loading.
Elevated Nitrate Levels
Elevated nitrate-N values are present in most of the major tributaries starting with the Redwood River and continuing downstream. The numbers underscore the need for Best Management Practices (BMPs) that reduce nitrate in streams. Source reduction, through effective nutrient management, is an important first step. More research is needed at the minor watershed scale to evaluate why agricultural watersheds deliver more nitrate-N and what can be done about it.
Phosphorus Sources
We need to better understand the nature of the phosphorus sources and the location of source areas. Assessments are needed in major tributaries. Particular attention should be placed on identifying 1) highly-erodible lands that are not presently treated with conservation practices, 2) land adjacent to streams and ditches, 3) actively eroding streambanks, ravines, and gullies, 4) municipal and industrial point sources, 5) non-compliant animal waste systems, and 6) other potential sources.
CREP & BMP Improvements
More research is needed on potential water quality and aquatic ecosystem improvements in streams located in watersheds that have extensive participation in the Conservation Reserve Enhancement Program (CREP) and other Best Management Practices (BMP) programs. Furthermore, there needs to be continued research that will lead to new innovations for managing surface and subsurface runoff and erosion, particularly methods that can be effective during the critical May-July period.
|
| |
| FOR MORE INFORMATION |
| |
Contributors
Barr Engineering
Brown-Nicollet-Cottonwood Clean Water Project
Chippewa River Watershed Project
Hawk Creek Watershed Project
High Island Creek Watershed Assessment Project
Lac qui Parle-Yellow Bank Clean Water Partnership
Martin County Environmental Services
Metropolitan Council Environmental Services Program
Minnesota Department of Agriculture Monitoring and Assessment Program
Minnesota Pollution Control Agency
Redwood-Cottonwood Rivers Control Area
Watonwan River Clean Water Partnership
Water Resources Center: Minnesota State University, Mankato
Yellow Medicine River Watershed District
Contact Information
Minnesota River Basin Data Center:
Water Resources Center,
Minnesota State University, Mankato
Website: mrbdc.mnsu.edu
Phone: 507-389-5492
Minnesota Pollution Control Agency
Website: www.pca.state.mn.us
Metropolitan Council Environmental Services
Website: www.metrocouncil.org/environment/RiversLakes/
Minnesota Department of Agriculture
Website: www.mda.state.mn.us
University of Minnesota:
Department of Soil, Water, and Climate
Website: www.soils.agri.umn.edu/research/mn-river/
|
|
This page was last updated 9/05
|


