
There
are a total of three monitoring sites in the watershed. At each site equipment
is installed to measure continuous stream flow conditions 24 hours a day.
The solar panel provides power to the equipment. The white box contains
a computer that stores the data and controls the equipment—the brains
of the system. The brown box houses automatic sampling equipment which
is programmed to take water quality samples during storm events.
Monitoring and other field tests occur from April through September each
year. Watershed scientists monitor for nitrate nitrogen, total phosphorus
and ortho-phosphorus, fecal coliform and e. coli bacteria, turbidity,
and total suspended sediments. Monitoring has shown high levels of sediment,
nitrates, and e. coli bacteria and moderate levels of phosphorus entering
Seven Mile Creek. (major contaminants, water quality monitoring results).
The results from a 1999-2001 study of Seven Mile Creek Watershed can be
downloaded here.
The vast majority of sediment, phosphorus, and nitrate losses from the
watershed take place in the spring months. More than 60 percent of the
growing season load carried by Seven Mile Creek to the Minnesota River
occurs in just three months—April, May and June. (More about sediment
and nutrient sources).
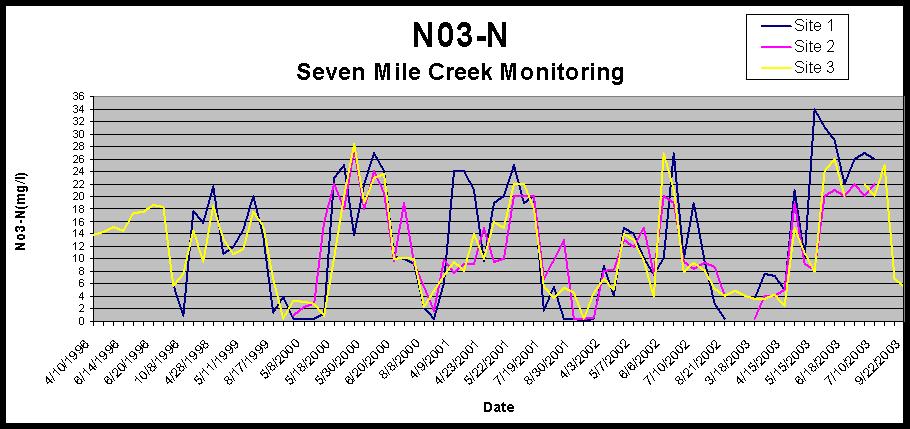
For example, the chart below illustrates nitrate nitrogen monitoring from
1996 to 2002. The different color lines illustrate levels (mg/l) at monitoring
site 1 (blue), 2 (pink) and 3 (yellow). On average, the watershed contributes
about 21.3 pounds per acre of nitrate to the Minnesota River. This equals
over 501,000 pounds of nitrogen each growing season (April - September).
Next

BNC home | mrbdc home | web site map |