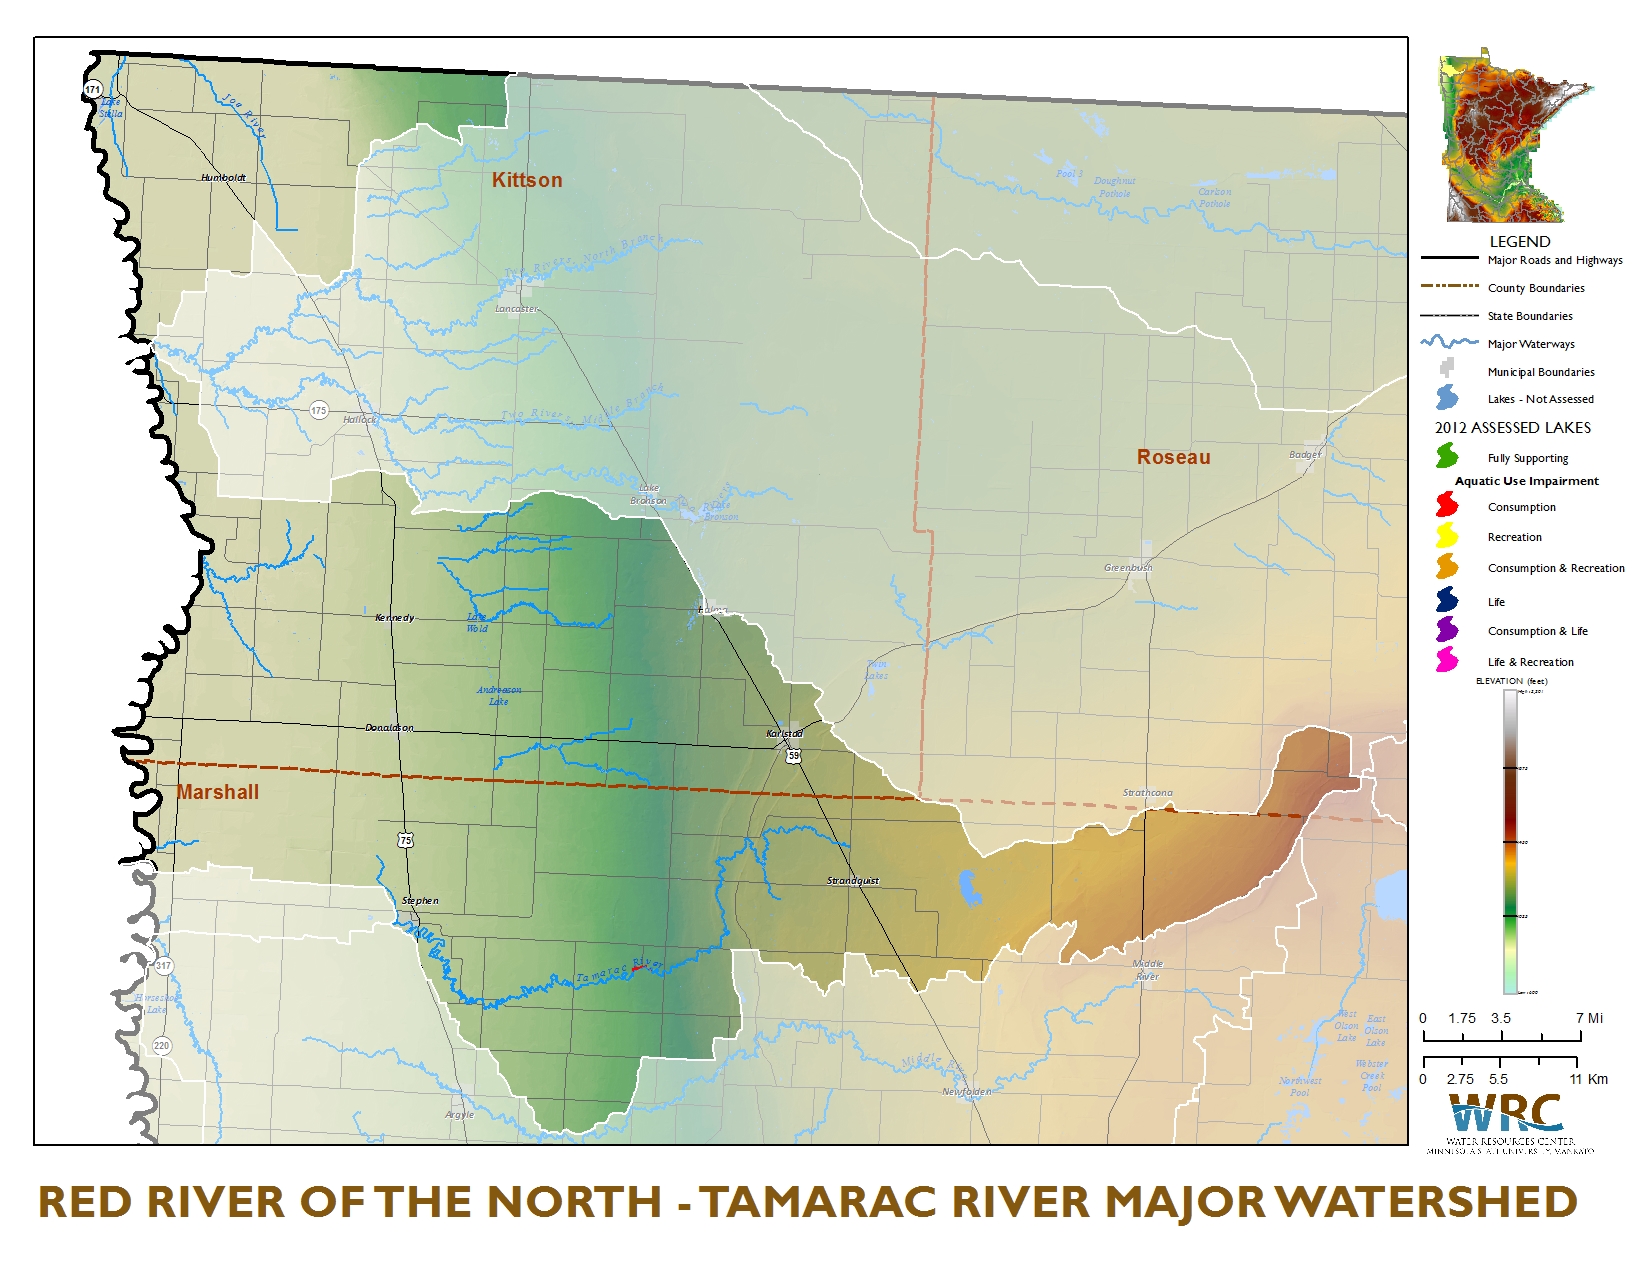
Red River of the North - Tamarac River
Overall Watershed Tabs
Vertical Tabs
Nitrogen (N) is one of the most widely distributed elements in nature and is present virtually everywhere on the earth’s crust in one or more of its many chemical forms. Nitrate (NO3), a mobile form of N, is commonly found in ground and surface waters throughout the country. Nitrate is generally the dominant form of N where total N levels are elevated. Nitrate and other forms of N in water can be from natural sources, but when N concentrations are elevated, the sources are typically associated with human activities (Dubrovski et al., 2010). Concerns about nitrate and total N in Minnesota’s water resources have been increasing due to effects of nitrate on certain aquatic life and drinking water supplies, along with increasing N in the Mississippi River and its impact on Gulf of Mexico oxygen depletion.
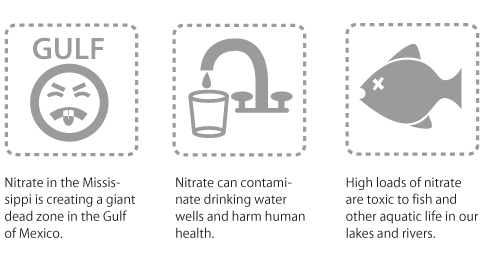
- Elevated nitrate levels harm fish and aquatic life.
- Because nitrate moves primarily via groundwater and tile drainage waters (not surface runoff), it can pollute drinking water wells.
- Nitrate leaving Minnesota via the Mississippi River contributes to the oxygen-depleted dead zone in the Gulf of Mexico.
Where does nitrate come from?
- More than 70% of the nitrate is coming from cropland, the rest from sources such as wastewater treatment plants, septic and urban runoff, forest, and the atmosphere.
- Municipal wastewater contributes 9% of the statewide nitrate load.
- Nitrate leaching into groundwater below cropped fields and moving underground until it reaches streams, contributes an estimated 30% of statewide nitrate to surface waters.
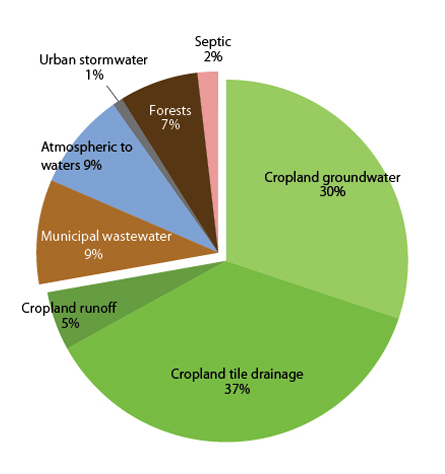
Source: Nitrogen in Minnesota Surface Waters (2013)
How does nitrate move from cropland into our water?
- The amount of nitrate reaching surface waters from cropland varies tremendously, depending on the type of crops, tile drainage practices, cropland management, soils, climate, geology and other factors.
- Tile drainage is the highest estimated cropland source pathway.
- Precipitation amounts have a pronounced effect on nitrate loads. During a dry year, loads may drop by 49% compared to an average year, however during a wet year, overall loads may increase by 51%.
- Nitrate concentrations and loads are high throughout much of southern Minnesota, resulting largely from leaching through large parts of intensively cropped soils and into underlying tile drains and groundwater.
- Cropland sources account for an estimated 89 to 95% of the nitrate load in the Minnesota, Missouri, and Cedar Rivers, and Lower Mississippi River basins.
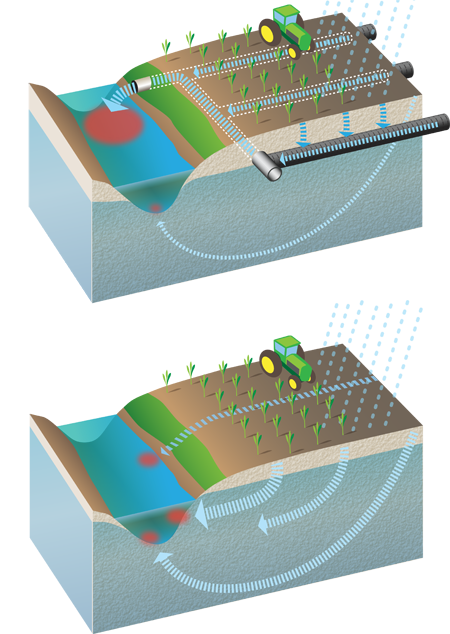 Source: Nitrogen in Minnesota Surface Waters (2013) Source: Nitrogen in Minnesota Surface Waters (2013) |
Tile drainage pathway |
Where does the nitrate go?
- Groundwater nitrate can take from hours to decades to reach surface waters.
- The highest nitrate-yielding watersheds are Cedar, Blue Earth and Le Sueur in south-central Minnesota.
- The Minnesota River adds twice as much nitrate to the Mississippi River as the combined loads from the Upper Mississippi and St. Croix Rivers.
- On average, 158 million pounds of nitrate leaves Minnesota per year in the Mississippi River — 75% comes from Minnesota watersheds.
- Nitrate concentrations have steadily increased in the Mississippi River since the mid-1970s.
-
Nitrate loads leaving Minnesota via the Mississippi River contribute to the oxygen-depleted “dead zone” in the Gulf of Mexico (currently estimated to be the size of Massachusetts). The dead zone cannot support aquatic life, affecting commercial and recreational fishing and the overall health of the Gulf.
How do we reduce the nitrate going into surface waters?
Tactics for reducing cropland nitrate going into surface waters fall into three categories:
- Manage in-field nutrients (i.e., optimize fertilizer rates, apply fertilizer closer to timing of crop use)
- Manage and treat tile drainage water (i.e., plan tile spacing and depth; control drainage; construct and restore wetlands for treatment purposes; and bioreactors)
- Diversify vegetation/landscape (i.e., plant cover crops; plant more perennials on marginal cropland, riparian zones and other areas)
Nitrate fertilizer efficiency has improved during the past two decades. While further refinements in fertilizer rates and application timing can be expected to reduce nitrate loads by roughly 13% statewide, additional and more costly practices will also be needed to make further reductions and meet downstream needs. Statewide reductions of more than 30% are not realistic with current practices.
To see progress, nitrate leaching reductions are needed across large parts of southern Minnesota, particularly on tile-drained fields and row crops over thin or sandy soils. Only collective incremental changes by many over broad acreages will result in significant nitrogen reductions to downstream waters.
Nitrogen is considered a limiting nutrient in the Gulf of Mexico, the body of water where much of Minnesota’s river and stream waters ultimately discharge. When nutrients in the Mississippi River originating in 31 states reach the Gulf of Mexico, a low oxygen “dead zone” known as hypoxia develops.
Hypoxia, which means low oxygen, occurs when excess nutrients, primarily N and P, stimulate algal growth in the Mississippi River and gulf waters. The algae and associated zooplankton grow well beyond the natural capacity of predators or consumers to maintain the plankton at a more balanced level. As the short-lived plankton die and sink to deeper waters, bacteria decompose the phytoplankton carbon, consuming considerable oxygen in the process. Water oxygen levels plummet, forcing mobile creatures like fish, shrimp, and crab to move out of the area. Less mobile aquatic life become stressed and/or dies.
The freshwater Mississippi River is less dense and warmer compared to the more dense cooler saline waters of the gulf. This results in a stratification of the incoming river waters and the existing gulf waters, preventing the mixing of the oxygen-rich surface water with oxygen-poor water on the bottom. Without mixing, oxygen in the bottom water is limited and the hypoxic zone remains. Hypoxia can persist for several months until there is strong mixing of the ocean waters, which can come from a hurricane or cold fronts in the fall and winter.
Hypoxic waters have dissolved oxygen concentrations of less than about 2-3 mg/l. Fish and shrimp species normally present on the ocean floor are not found when dissolved oxygen levels reduce to less than 2 mg/l. The Gulf of Mexico hypoxic zone is the largest in the United States and the second largest in the world. The maximum areal extent of this hypoxic zone was measured at 8,500 square miles during the summer of 2002. The average size of the hypoxic zone in the northern Gulf of Mexico in recent years (between 2004 and 2008) has been about 6,500 square miles, the size of Lake Ontario.
Minnesota Nitrogen Study
The MPCA conducted a study of nitrogen in surface waters so that we can better understand the nitrogen conditions in Minnesota’s surface waters, along with the sources, pathways, trends and potential ways to reduce nitrogen in waters.
Excerpts from Nitrogen in Minnesota Surface Waters
![]() Sources of Nitrogen - Results Overview
Sources of Nitrogen - Results Overview
![]() Sources of Nitrogen - Wastewater Point Source Nitrogen Loads
Sources of Nitrogen - Wastewater Point Source Nitrogen Loads
![]() Sources of Nitrogen - Atmospheric Deposition of Nitrogen in Minnesota Watersheds
Sources of Nitrogen - Atmospheric Deposition of Nitrogen in Minnesota Watersheds
Statewide - N Sources to Waters - Average Year
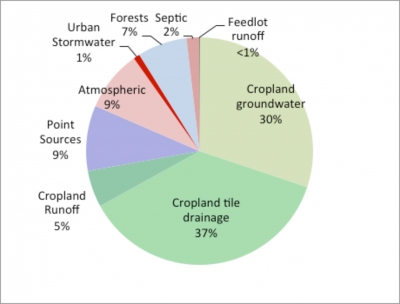
Source: Nitrogen in Minnesota Surface Waters, Sources of Nitrogen - Results Overview (2013)
Cropland sources contribute an estimated 73 percent of the statewide N load during an average precipitation year. Cropland nitrogen is primarily delivered to surface waters through subsurface pathways of tile drainage and groundwater.
Statewide - N Sources to Surface Waters Chart -Average Year
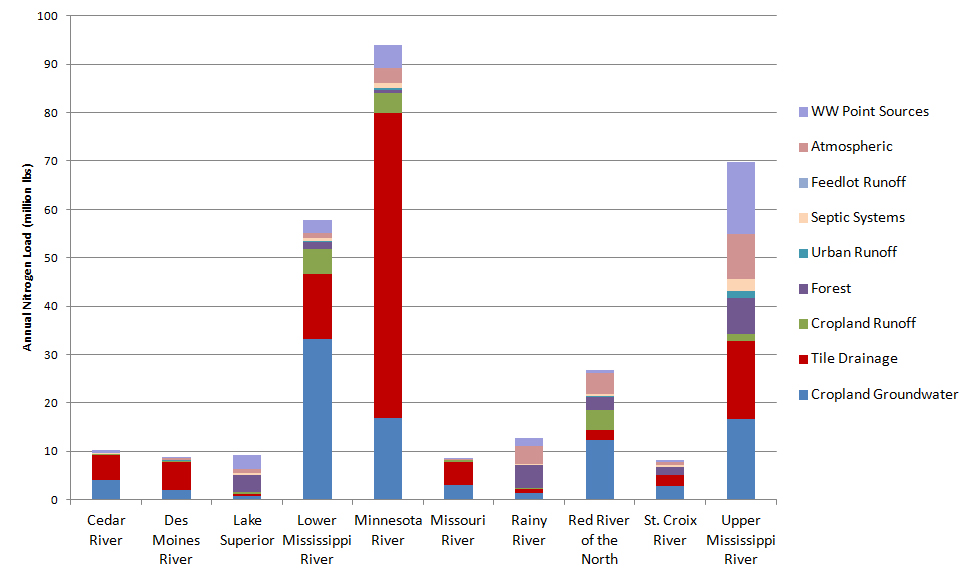
Source: Nitrogen in Minnesota Surface Waters, Sources of Nitrogen - Results Overview (2013)
Estimated N loads to surface waters from different sources within the Minnesota portions of major basins during an average precipitation year. “Ag” represents cropland sources.
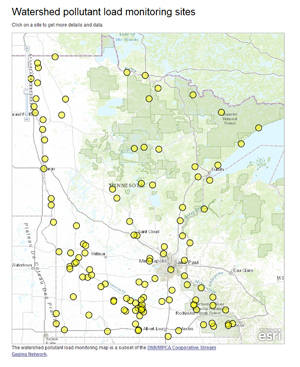
 Watershed Pollutant Load Monitoring Network - MPCA
Water Quality Databases
 DNR/MPCA Cooperative Stream Gaging Network – USGS, DNR, MPCA – Stream discharge and links to Division of Waters Resources, climate information, river levels, water quality information, recreation and commonly used hydrologic terms
 USGS – USGS discharge Information
 EDA Environmental Data Access – Water quality data collected for all MPCA monitoring projects
 EQuIS – Environmental Quality Information System – Water quality data from more than 17,000 sampling locations across the state.
|
|
 |
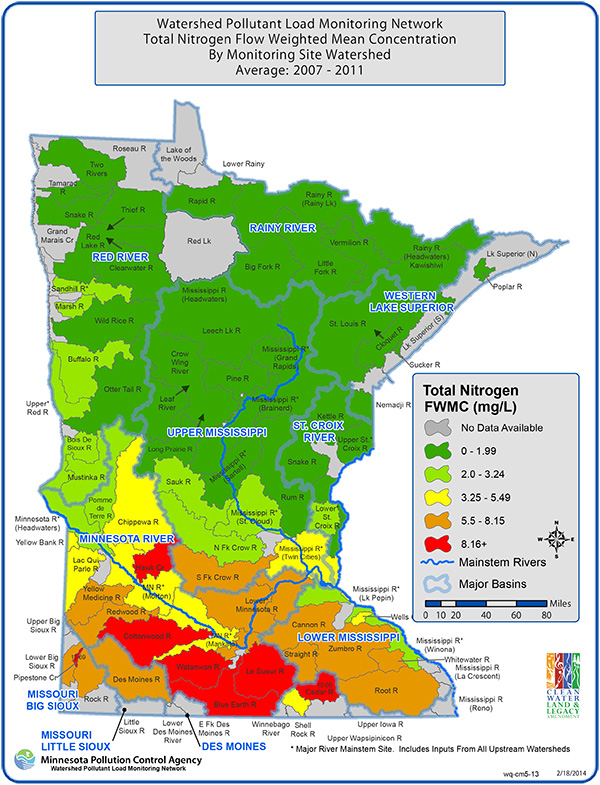
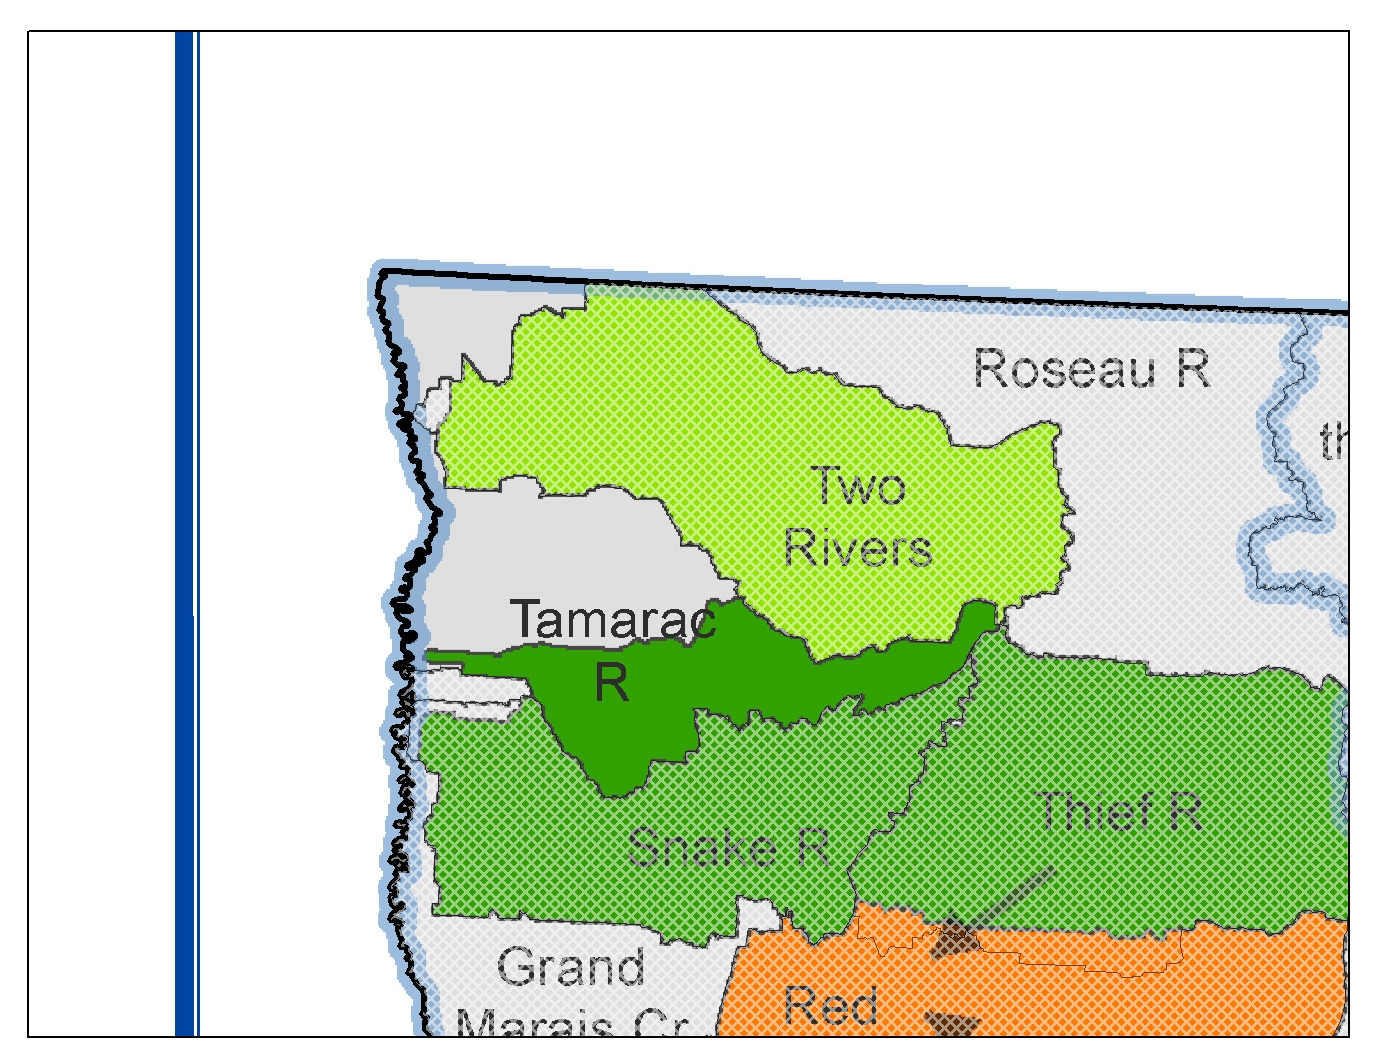
Source: Watershed Pollutant Load Monitoring Network - MPCA (2014)
Average annual flow-weighted mean concentrations for Total Nitrogen near watershed outlets based on annual averages derived from available information collected in 2007-11.
 |
|
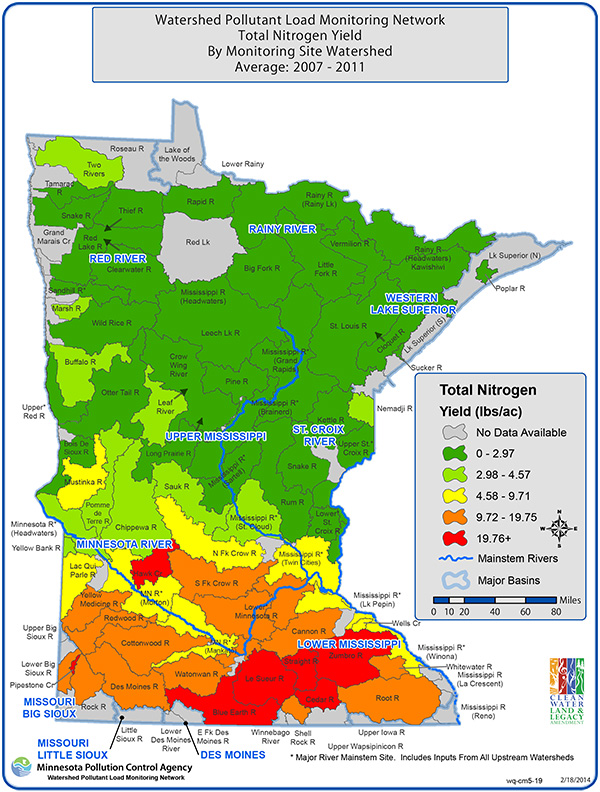
Source: Watershed Pollutant Load Monitoring Network - MPCA (2014)
Average annual yield (lbs/acre) for Total Nitrogen near watershed outlets based on annual averages derived from available information collected in 2007-11.
 |
|
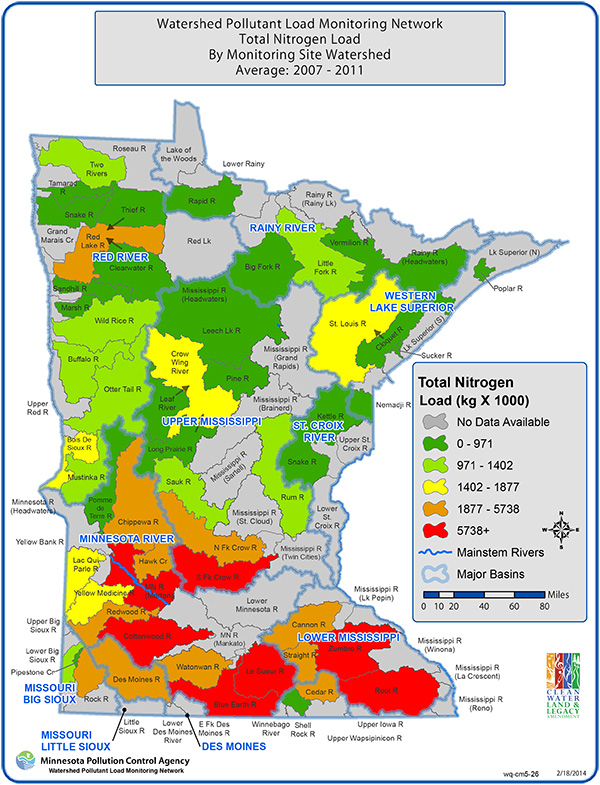
Source: Watershed Pollutant Load Monitoring Network - MPCA (2014)
Average annual Total Nitrogen Load near watershed outlets based on annual averages derived from available information collected in 2007-11.
Excerpts from: Nitrogen in Minnesota Surface Waters (2013),
Chapter B2. Conditions — Monitoring Mainstem River Nitrogen Loads
RED RIVER NITROGEN LOADING
The U.S. portion of the Red River Basin, depicted in Figure 25, originates mostly in Minnesota and North Dakota, with a small percentage also in South Dakota. After crossing the U.S./Canadian border, additional Manitoba watersheds flow into the Red River before it discharges into Lake Winnipeg.
Red River Basin Boundaries
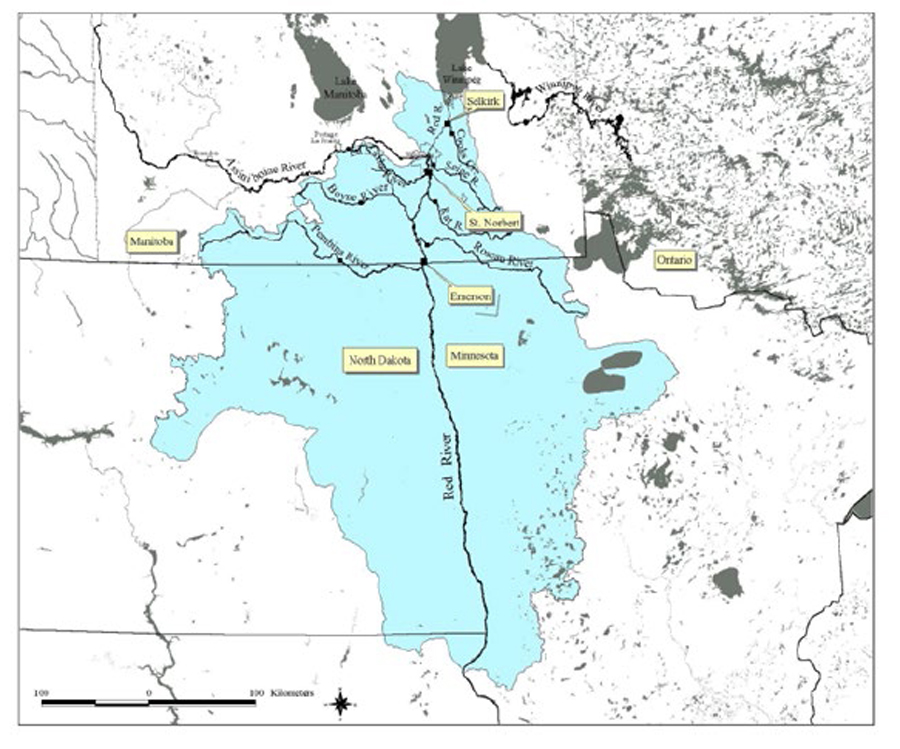
Source: Nitrogen in Minnesota Surface Waters (2013), Chapter B2. Conditions — Monitoring Mainstem River Nitrogen Loads Map from Bourne et al., 2002.
Minnesota’s contribution to Emerson nitrogen loads
Based on unpublished data provided by Environment Manitoba (Manitoba Water Stewardship and Environment Canada, the average Red River annual TN load between 1994 and 2008 at the Canadian border in Emerson, Manitoba was 37,326,000 pounds/year (Figure 26). Nitrate concentrations are relatively low in the Red River, and only 42% of the TN is in the nitrate form, with the remainder as TKN (organic-N and ammonia+ammonium-N). Most of the Red River load in Emerson originates in the United States, with only 5.5% coming from Canadian watersheds which flow into North Dakota before joining up with the Red River in the United States. Therefore, 94.5% of the 37 million pounds of N reaching the Canadian border in the Red River is from Minnesota and the Dakotas. Of the United States contributions, SPARROW modeling results indicate that 48% of the United States load is from Minnesota, and 52% is from the Dakotas (see Chapter B4).
Therefore, if we assume 37,326,000 pounds/year of TN at Emerson, of which 94.5% is from the United States and 48% of that amount is from Minnesota, Minnesota’s N contribution to the Red River is estimated as 16,931,000 pounds/year, on average.

Red River estimated annual N Loads based on monitoring data at Emerson, Manitoba near the U.S./Canadian border. Monitoring and load calculations from Manitoba Conservation Water Stewardship and Environment Canada. Only TN was available for 2000. Source: Nitrogen in Minnesota Surface Waters (2013), Chapter B2. Conditions — Monitoring Mainstem River Nitrogen Loads
United States contributions to Lake Winnipeg
Environment Canada (2011) assessed TN loads from the period 1994 to 2007, including loads from such sources as atmospheric deposition directly into Lake Winnipeg. They concluded that the Red River from the United States and Canada watersheds contributed 34% of the N load to Lake Winnipeg. In an earlier report, Bourne et al. (2002) concluded that 65% of the Red River N comes from the United States. Combining these results, we can assume that approximately 22% of the N load to Lake Winnipeg comes from watersheds in Minnesota and the Dakotas, with about 11% of the Lake Winnipeg TN load from Minnesota.
Source: Nitrogen in Minnesota Surface Waters (2013), Chapter B2. Conditions — Monitoring Mainstem River Nitrogen Loads
Excerpts from  Nitrogen in Minnesota Surface Waters
![]() Chapter 4: Modeled Nitrogen Loads (SPARROW)
Chapter 4: Modeled Nitrogen Loads (SPARROW)
The Nitrogen in Minnesota Surface Waters Report shows elevated nitrate levels, particularly in the southern third of Minnesota.
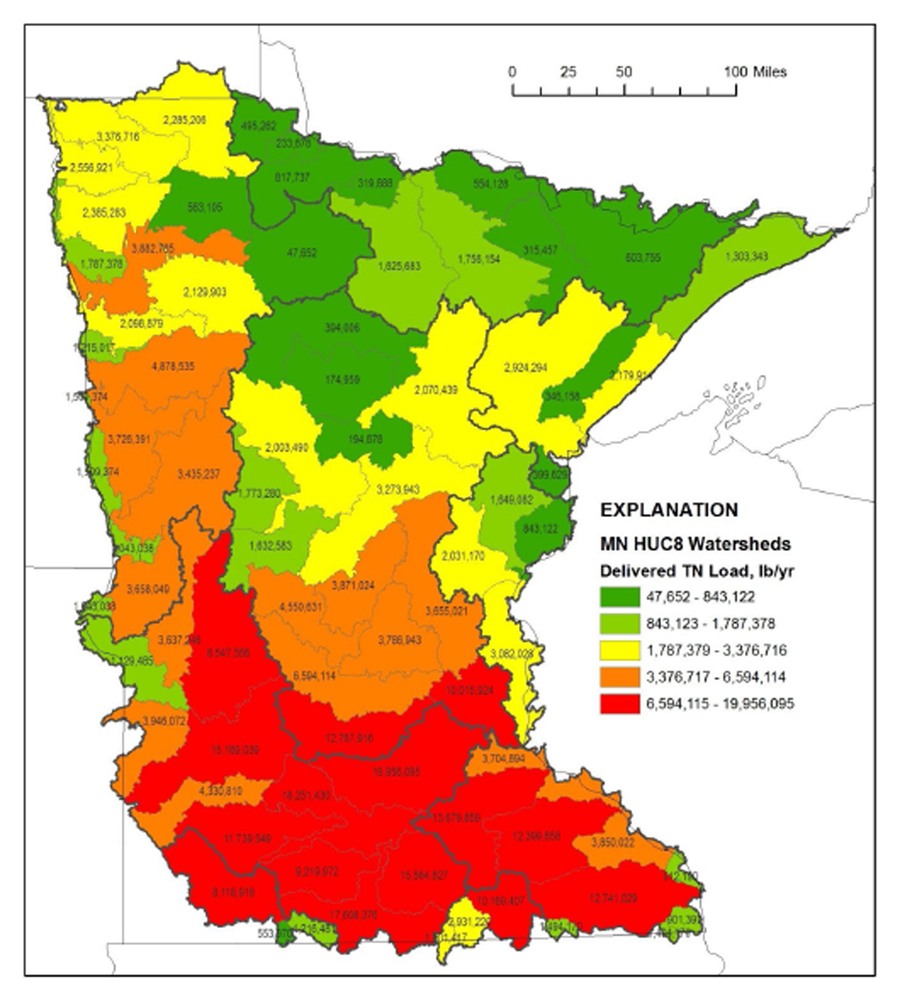 |
Source: Nitrogen in Minnesota Surface Waters, Chapter 4: Modeled Nitrogen Loads (SPARROW) (2013)
 |
 |
Source: Nitrogen in Minnesota Surface Waters, Chapter 4: Modeled Nitrogen Loads (SPARROW) (2013)
Data Source: SPARROW flow-weighted mean TN concentration by HUC8 watersheds. The value represents the median FWMC of all subwatershed catchments within the HUC8 watersheds.
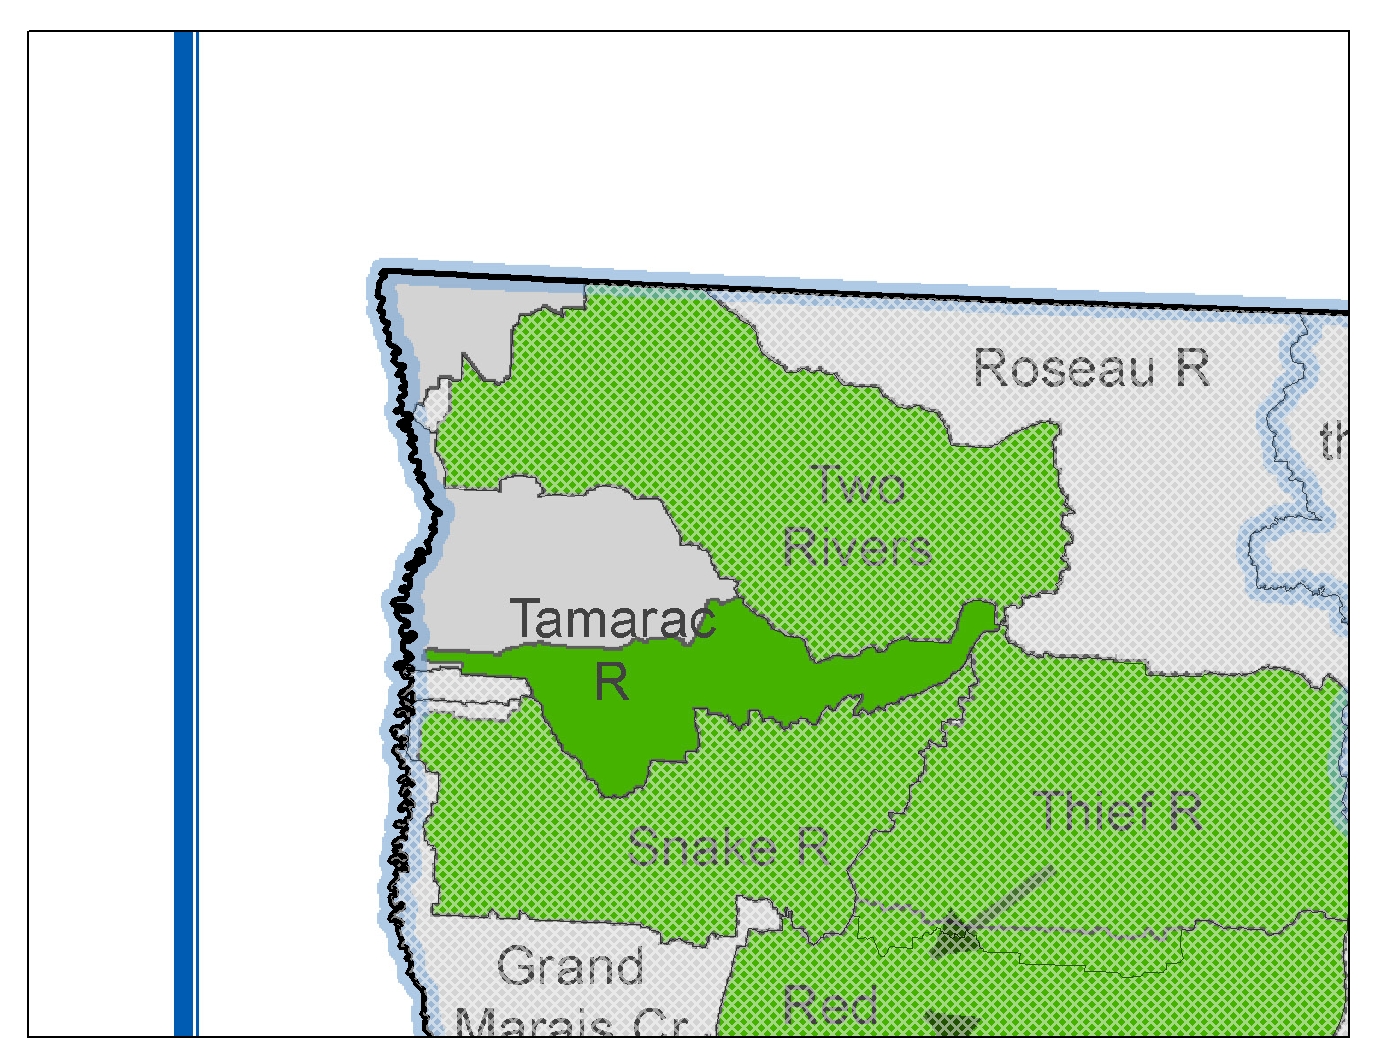
SPARROW Modeling for the Red River-Tamarac River Watershed indicated average flow-weighted mean TN concentration of 6.57 mg/l. This value represents the median FWMC of all subwatershed catchments within the Red River- Tamarac River Watershed.
 |
 |
Source: Nitrogen in Minnesota Surface Waters, Chapter 4: Modeled Nitrogen Loads (SPARROW) (2013)
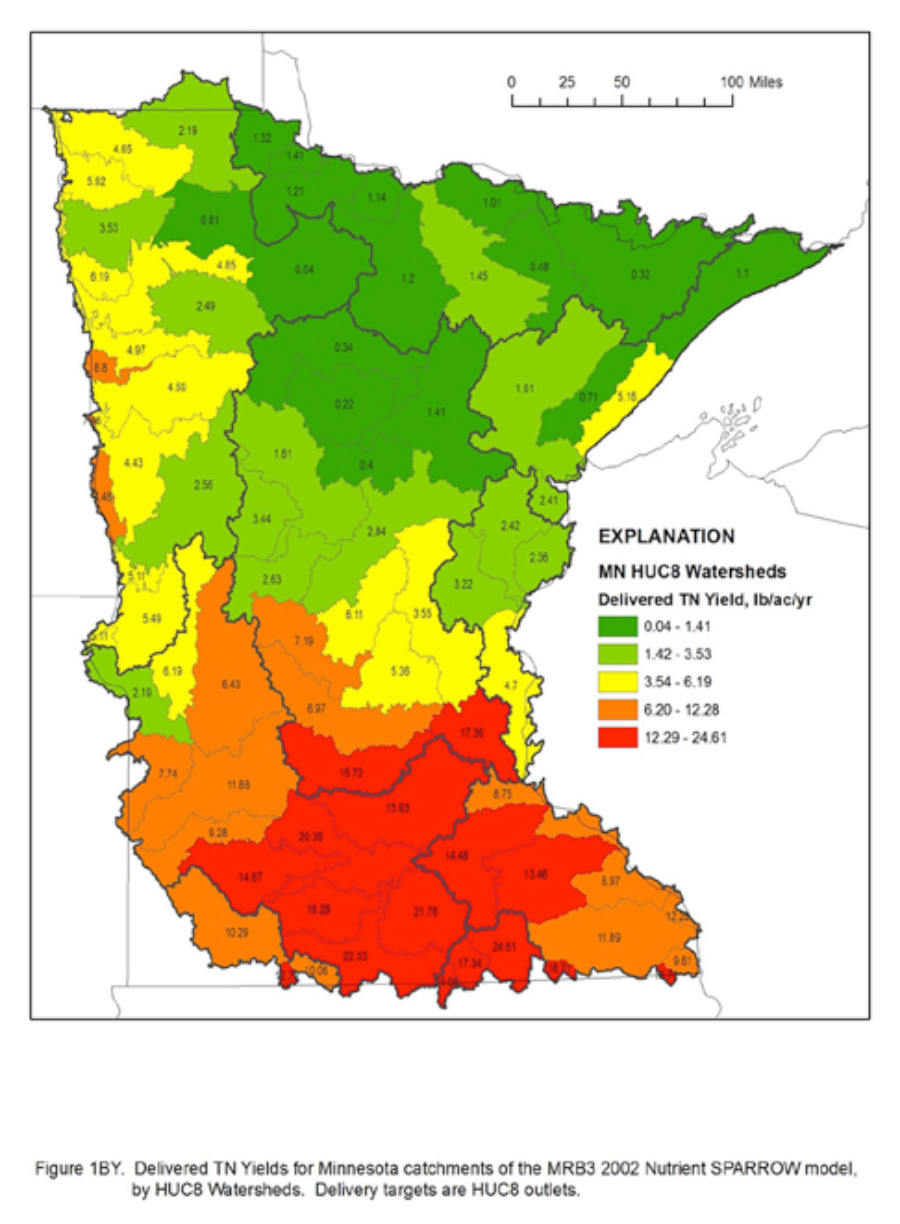
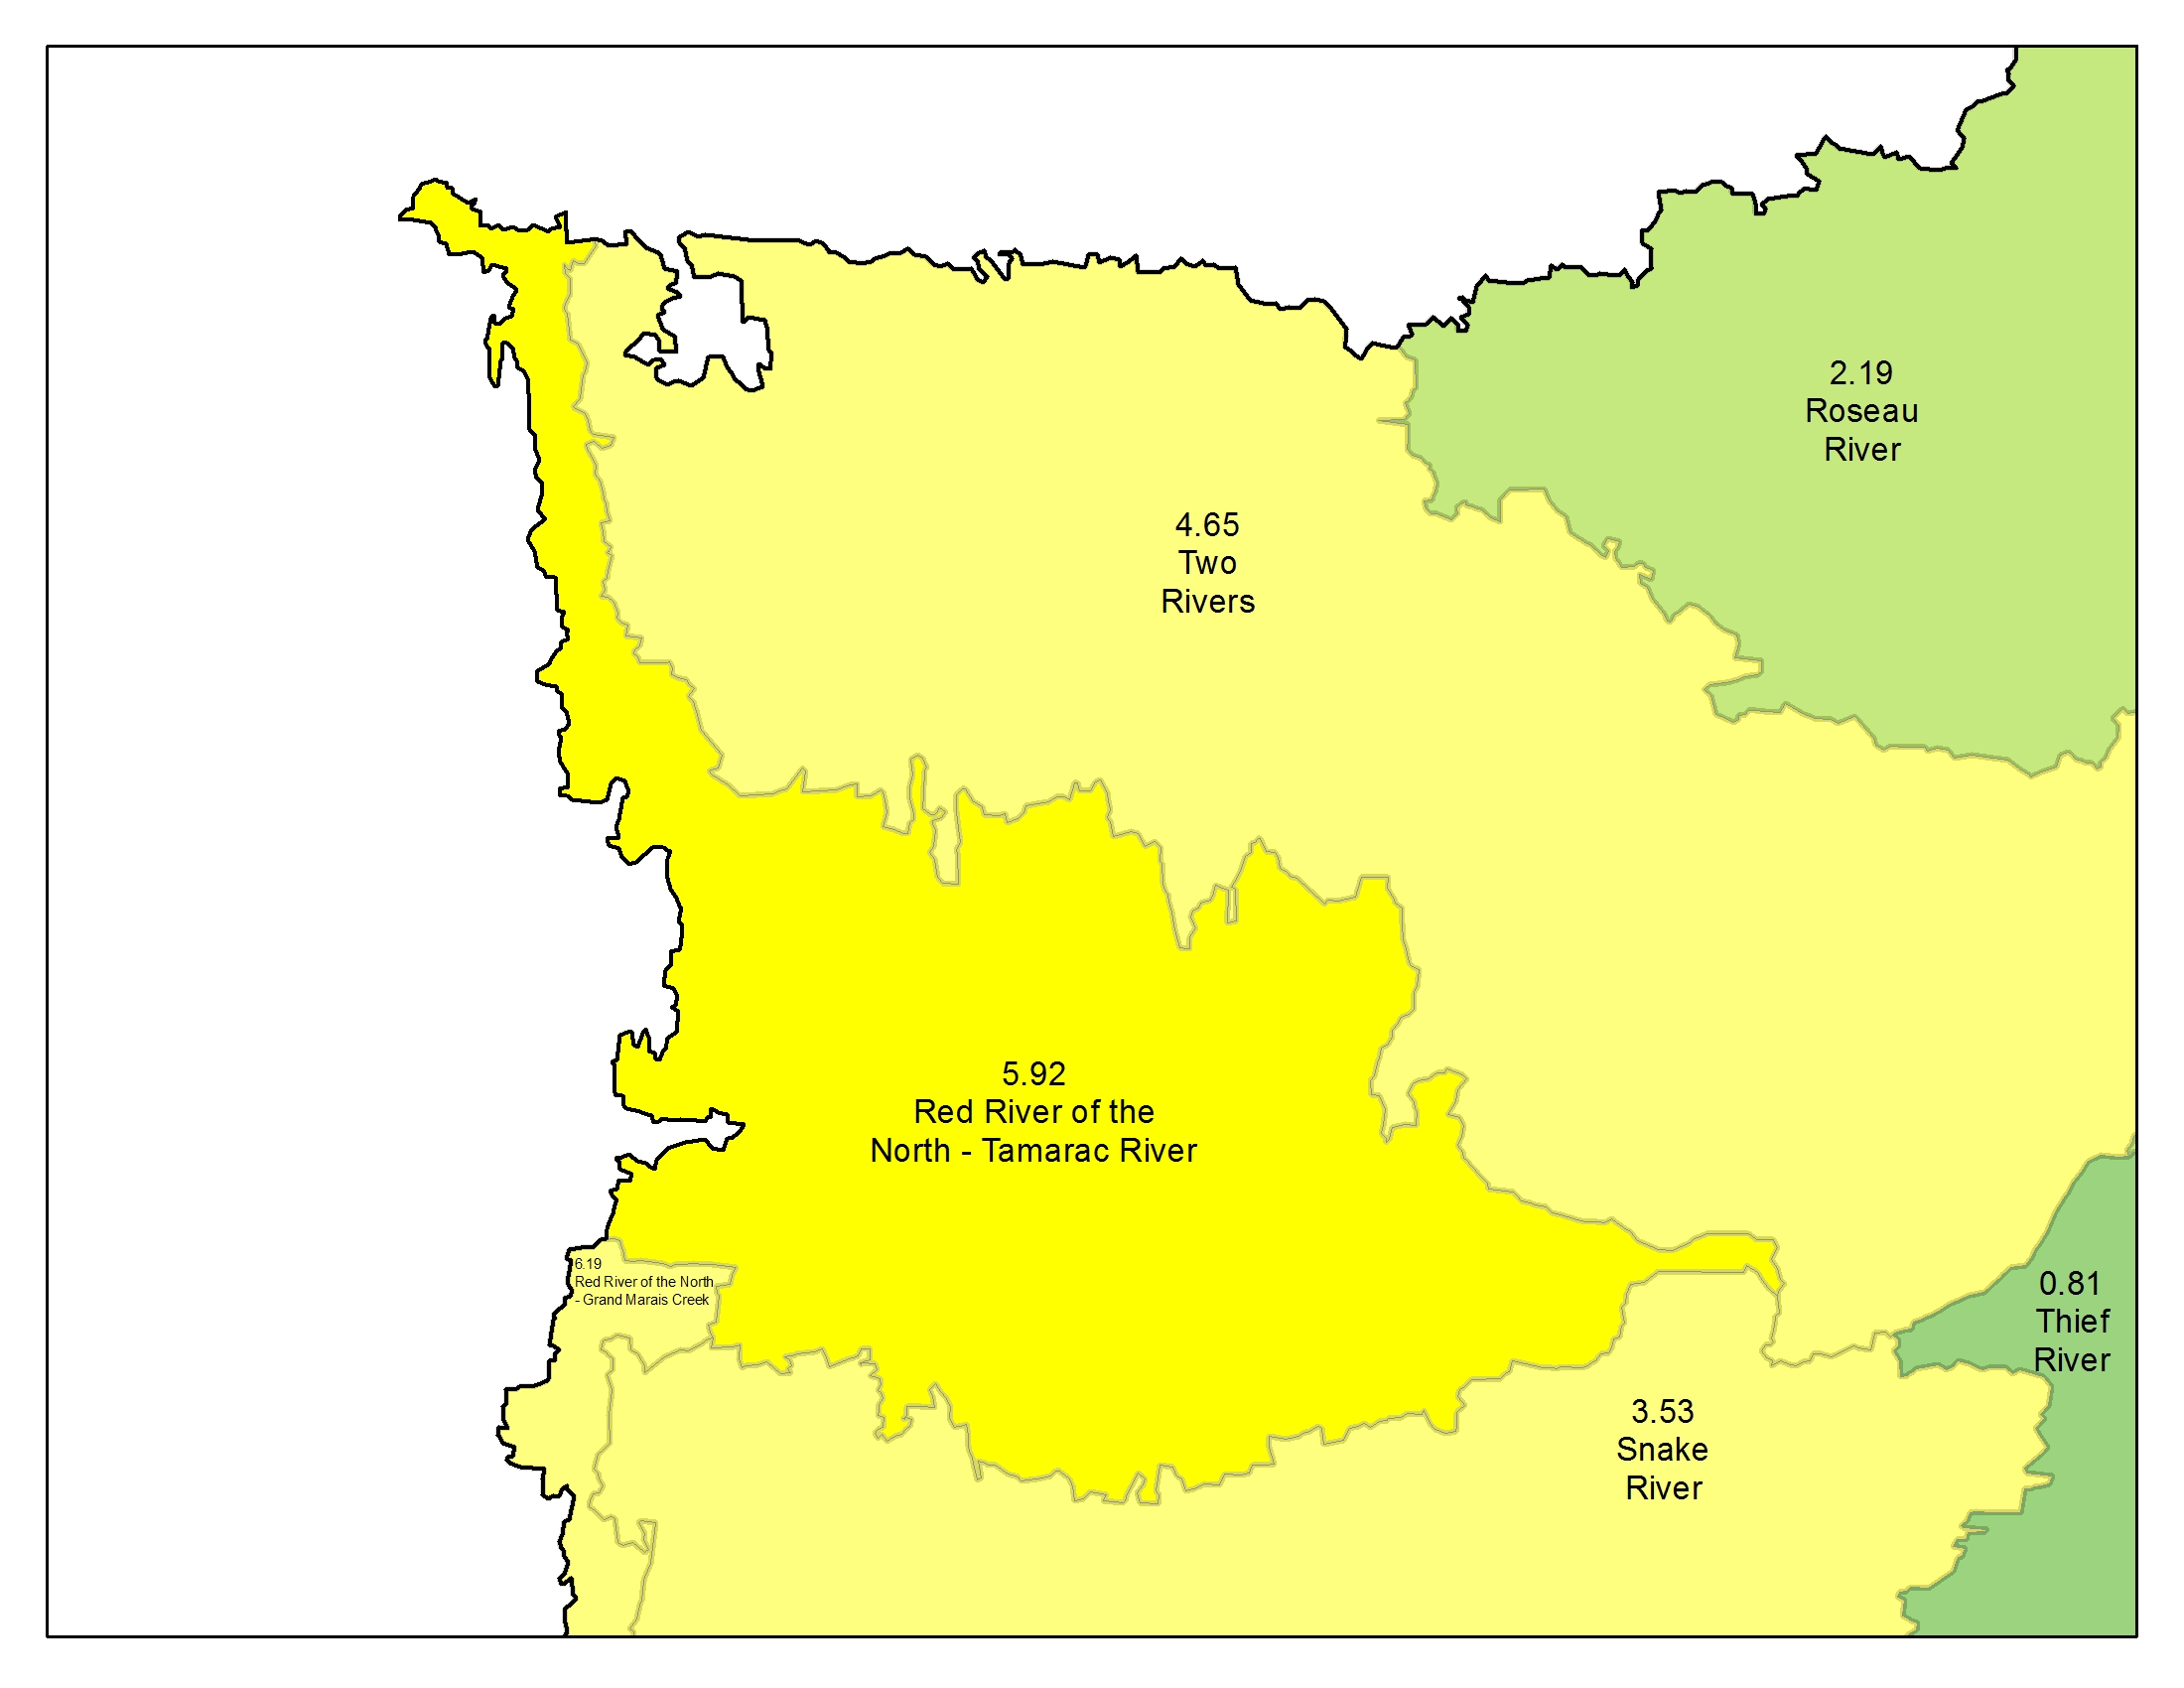
SPARROW model annual TN yield results by HUC8 watershed in lbs/acre/year. The basin yields represent the total load delivered to the watershed outlet or state border divided by the sum of the SPARROW (MRB3 2002) catchment area.
SPARROW model annual TN yield results for the Red River - Tamarac River Watershed was 5.92 lbs/acre/year.
Statewide Comparison of Nitrate+Nitrate-N Yields (lbs/ac)
|
|
Nitrite+Nitrate-N |
|
S. Central |
11-19 |
|
Southeast |
8-9 |
|
Southwest |
4-9 |
|
Central |
1-2 |
|
Northwest |
0.1-1 |
|
Northeast |
0.1-2 |
Source: Nitrogen in Minnesota Surface Waters (2013)
SPARROW modeled delivered loads for Red River Basin HUC 8 Watersheds
|
WS # |
Watershed Name |
SPARROW delivered load to state border |
|
09020101 |
Bois de Sioux River |
1,025,263 |
|
09020102 |
Mustinka River |
629,665 |
|
09020103 |
Otter Tail River |
3,376,696 |
|
09020104 |
Upper Red River of the North |
1,491,545 |
|
09020106 |
Buffalo River |
3,682,373 |
|
09020107 |
Red River of the North - Marsh River |
1,204,886 |
|
09020108 |
Wild Rice River |
4,820,908 |
|
09020301 |
Red River of the North - Sandhill River |
2,082,969 |
|
09020302 |
Upper/Lower Red Lake |
46,853 |
| 09020303 |
Red Lake River |
3,836,901 |
| 09020304 |
Thief River |
553,662 |
| 09020305 |
Clearwater River |
2,104,744 |
| 09020306 |
Red River of the North - Grand Marais Creek |
1,773,828 |
| 09020309 |
Snake River |
2,367,201 |
| 09020311 |
Red River of the North - Tamarac River |
2,556,921 |
| 09020312 |
Two Rivers |
3,376,716 |
| 09020314 | Roseau River |
2,285,206 |
Source: Nitrogen in Minnesota Surface Waters, Chapter B4. Conditions — Modeled Nitrogen Loads (SPARROW) (2013)
Statewide Nitrate Trends
Excerpts from  Nitrogen in Minnesota Surface Waters
![]() Nitrate Trends in Minnesota Rivers
Nitrate Trends in Minnesota Rivers
![]() Nitrogen Trend Results from Previous Studies
Nitrogen Trend Results from Previous Studies
Red River of the North Trend Results
Three sites on the Red River of the North were analyzed for trends in flow-adjusted nitrate concentrations. All three sites had relatively low nitrate concentrations, although the concentrations were higher at the downstream site in Perley. No trends were detected at the upper-most location at Brushvale. At Moorhead, and just downstream from Moorhead at Perley, concentrations increased prior to 1993-95, but had no significant trends after 1993 and 1995, respectively.
Tributaries of the Red River of the North
Trends were assessed for two tributaries of the Red River of the North, the Ottertail River and the Red Lake River, each with two monitoring locations. Similar to the Red River of the North at Brushvale, nitrate concentrations were very low, mostly between 0.1 and 0.15 mg/l. At these low concentrations, the Ottertail River showed a steady increasing trend since 1982. The percentage increase was greater in Fergus Falls than at the downstream site at Breckenridge (Table 14). The Red Lake River at East Grand Forks had a trend very similar to that of the Ottertail River in Breckenridge, both with gradually increasing nitrate concentrations by 35% over the entire time of analysis. Farther upstream at Fisher, no trends were detected.
See Trends — Nitrate Trends in Minnesota Rivers for more information.
Source: Nitrogen in Minnesota Surface Waters, Nitrate Trends in the Minnesota River Basin (2013)
Vertical Tabs
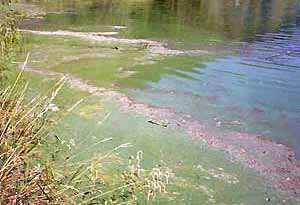
Phosphorus is the nutrient primarily responsible for the eutrophication (nutrient enrichment of waterbodies) of Minnesota’s surface waters. Phosphorus is an essential nutrient for plants, animals and humans. It is one of the 20 most abundant elements in the solar system, and the 11th most abundant in the earth’s crust. Under natural conditions phosphorus (P) is typically scarce in water. Human activities, however, have resulted in excessive loading of phosphorus into many freshwater systems. This can cause water pollution by promoting excessive algae growth, particularly in lakes. Lakes that appear relatively clear in spring can resemble green soup in late summer due to algae blooms fueled by phosphorus. Water quality can be further impaired when bacteria consume dead algae and use up dissolved oxygen,suffocating fish and other aquatic life.
An overabundance of phosphorus—specifically usable (bioavailable) phosphorus—results in excessive algal production in Minnesota waters. Phosphorus from point sources may be more bioavailable, impacting surface water quality more than a similar amount of nonpoint source phosphorus that enters the same surface water conditions. Total phosphorus levels of 100 or more ppb categorize lakes as highly eutrophic, with high nutrient and algae levels.
In some water bodies, the concentration of phosphorus is low enough to limit the growth of algae and/or aquatic plants. In this case, scientists say phosphorus is the limiting nutrient. For example, in water bodies having total phosphorus concentrations less than 10 parts per billion (1 ppb – equal to one drop in a railroad tank car), waters will be nutrient-poor and will not support large quantities of algae and aquatic plants.
MPCA
Phosphorus contributions to Minnesota surface waters by point and nonpoint sources are known to vary, both geographically and over time, in response to annual variations in weather and climate. Nonpoint sources of phosphorus tend to comprise a larger fraction of the aggregate phosphorus load to Minnesota surface waters during relatively wet periods, while point sources become increasingly important during dry periods.
The Minnesota Pollution Control Agency is currently developing new water quality standards for River Eutrophication and Total Suspended Solids. Visit the MPCA website for more information.
Sources:
 Minnesota Nutrient Reduction Strategy - MPCA
 Phosphorus: Sources, Forms, Impacts on Water Quality - MPCA
 New Water Quality Standards for River Eutrophication and Total Suspended Solids - MPCA
Excerpts From Minnesota Nutrient Reduction Strategy,  Chapter 5 Point and Nonpoint Source Reductions (2013)
 Detailed Assessment of Phosphorus Sources to Minnesota Watersheds (2004)
![]() Summary of Phosphorus Loading by Basin (2004)
Summary of Phosphorus Loading by Basin (2004)
Statewide Phosphorus Sources, Average Year

Source: Minnesota Nutrient Reduction Strategy, Chapter 5 Point and Nonpoint Source Reductions (2013)
Under normal water flows, roughly two- thirds of the total phosphorus load to lakes and rivers comes from nonpoint sources such as runoff from pasture and croplands, atmospheric deposition and stream bank erosion. Phosphorus loading contributed by runoff from pastures and croplands is largest source of nonpoint phosphorus on a statewide basis. Other nonpoint sources include urban runoff, non-agricultural rural runoff and seepage from individual sewage treatment systems.
Approximately 30 percent of the phosphorus load to Minnesota waters comes from point sources such as municipal and industrial wastewater treatment facilities. The magnitude of various sources of phosphorus varies greatly throughout the state due to the diverse nature of Minnesota’s watersheds.
Source: Minnesota Nutrient Reduction Strategy (2013)
Pollutant Load Monitoring Sites in Minnesota
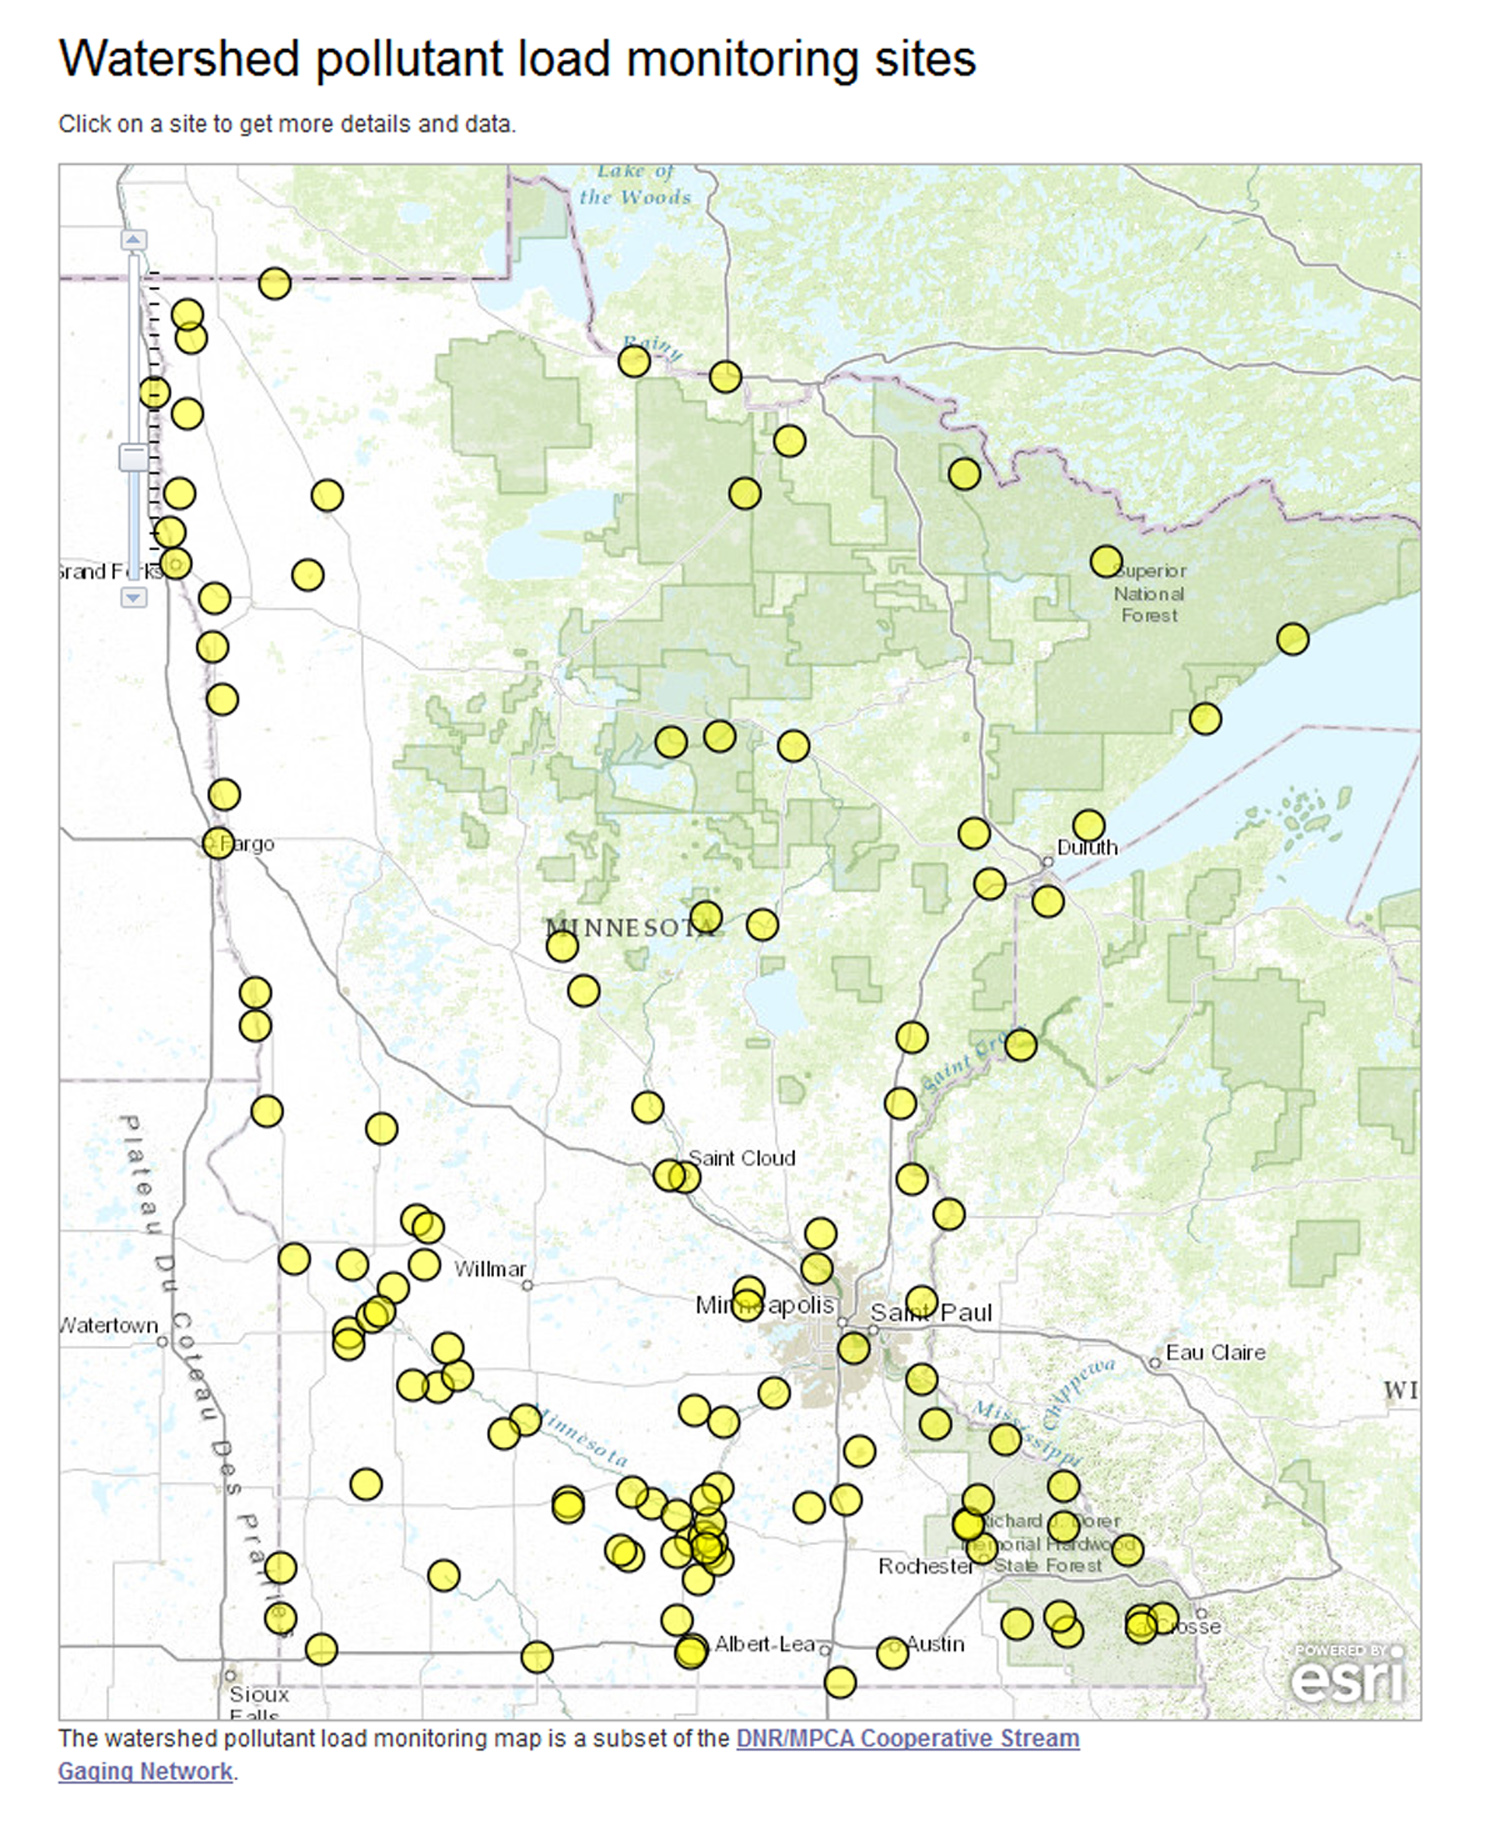
 Watershed Pollutant Load Monitoring Network - MPCA
Water Quality Databases
 DNR/MPCA Cooperative Stream Gaging Network – USGS, DNR, MPCA – Stream discharge and links to Division of Waters Resources, climate information, river levels, water quality information, recreation and commonly used hydrologic terms
 USGS – USGS discharge Information
 EDA Environmental Data Access – Water quality data collected for all MPCA monitoring projects
 EQuIS – Environmental Quality Information System – Water quality data from more than 17,000 sampling locations across the state.
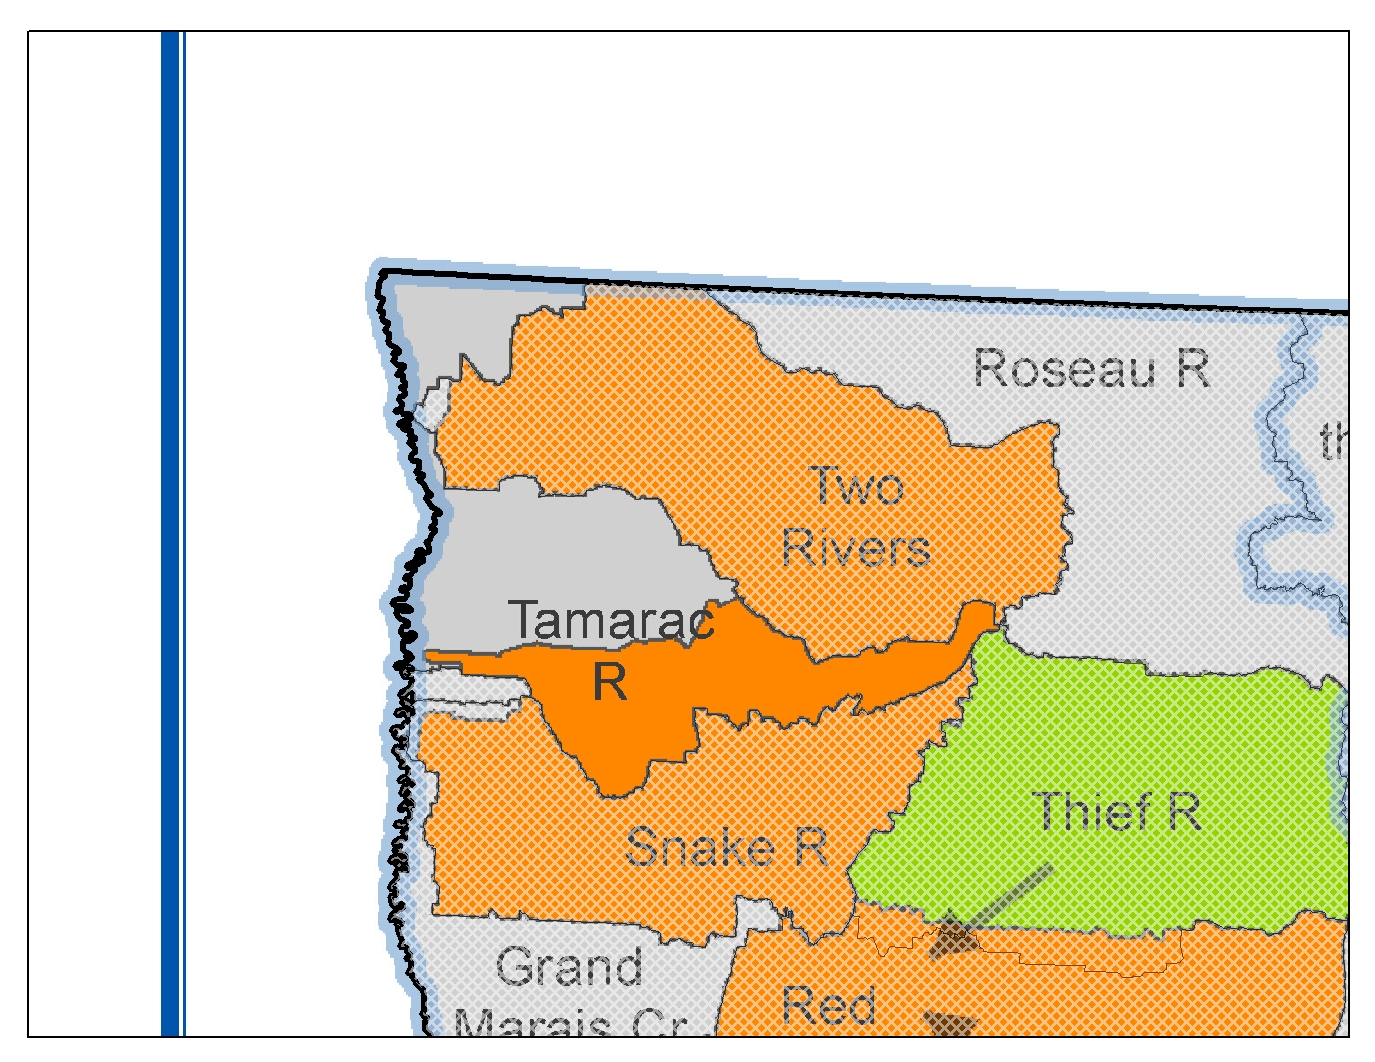 |
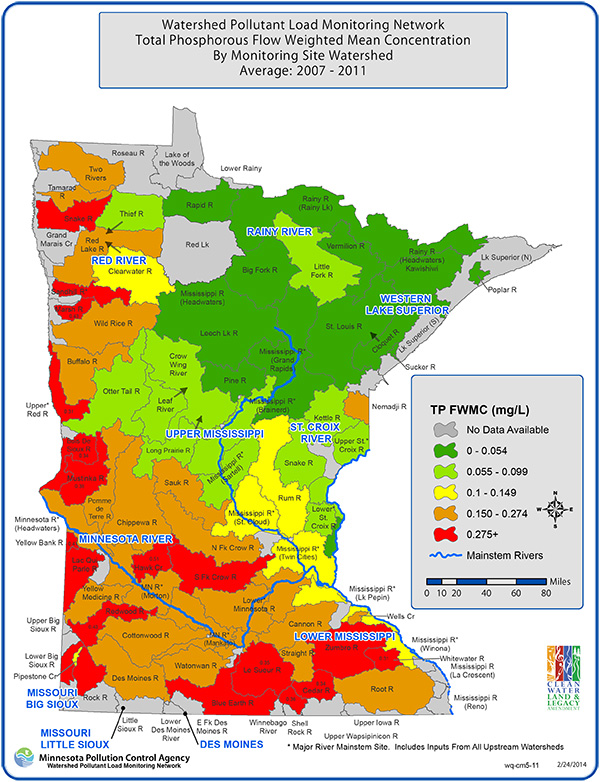
Source: Watershed Pollutant Load Monitoring Network - MPCA (2014)
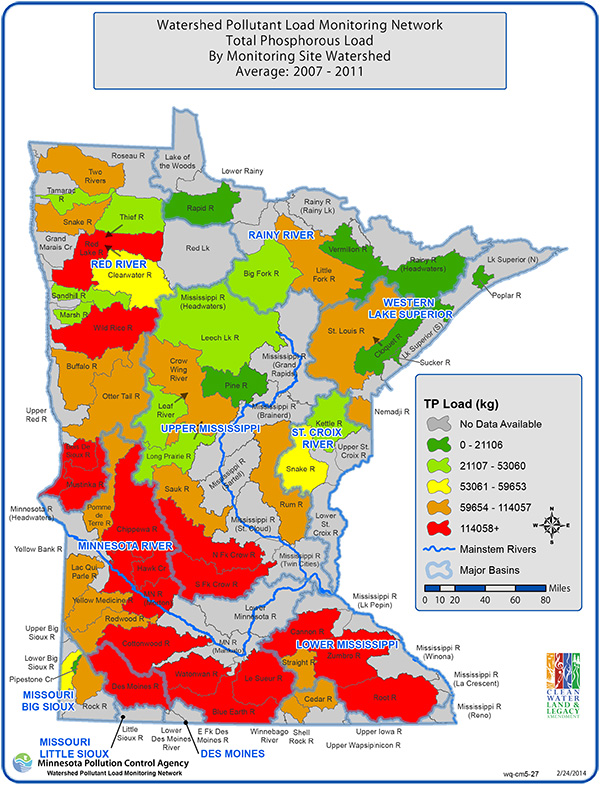
Average annual flow-weighted mean concentrations (mg/L) for Total Phosphorus near watershed outlets based on yearly averages derived from available information collected in 2007-011.
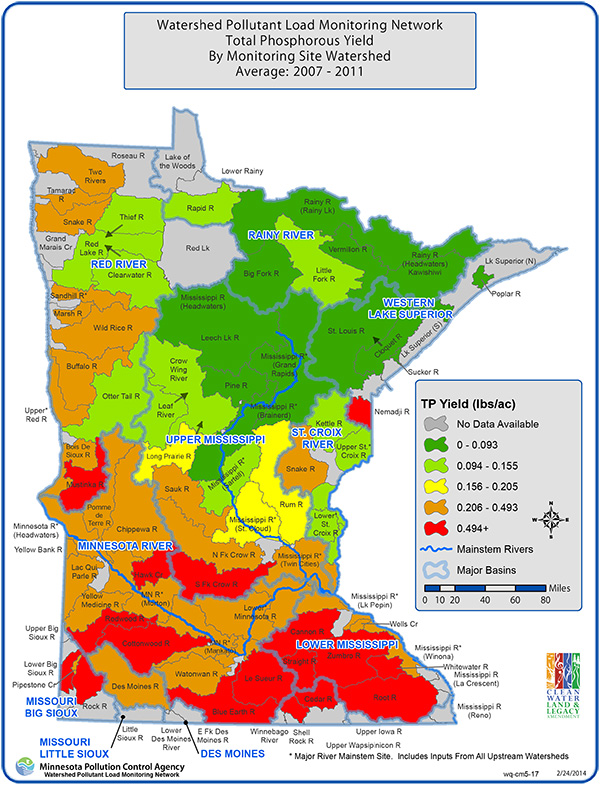 |
|
Source: Watershed Pollutant Load Monitoring Network - MPCA (2014)
Average annual Total Phosphorus Yield (lbs/acre) near watershed outlets based on yearly averages derived from available information collected in 2007-011.
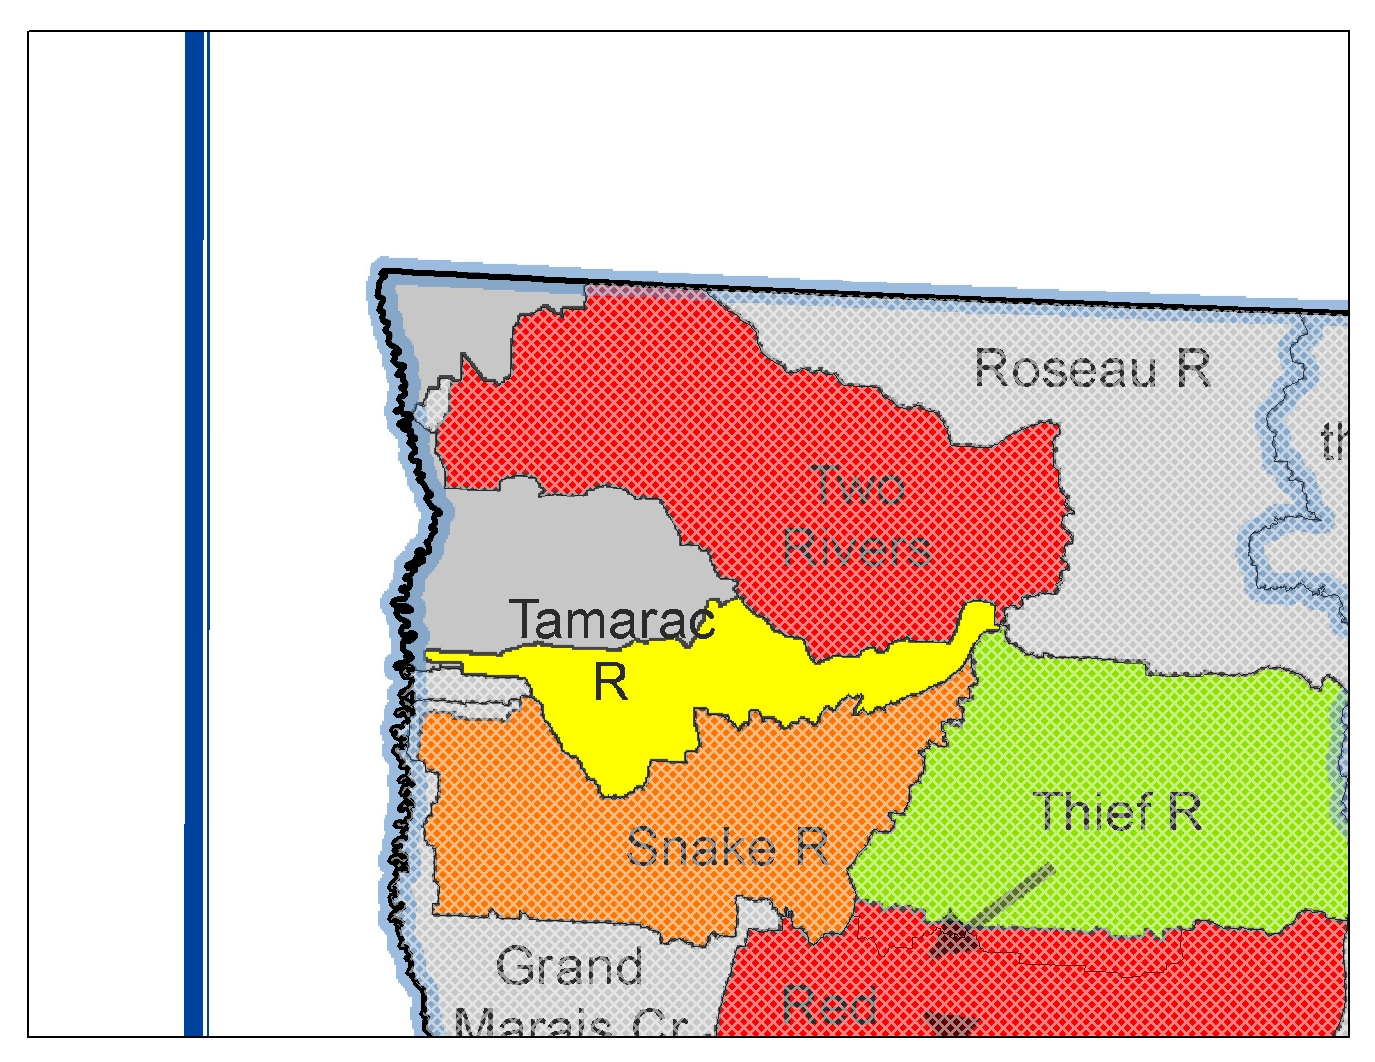 |
Source: Watershed Pollutant Load Monitoring Network - MPCA (2014)
Average annual Total Phosphorus Load (kg) near watershed outlets based on yearly averages derived from available information collected in 2007-011.
SPARROW modeling
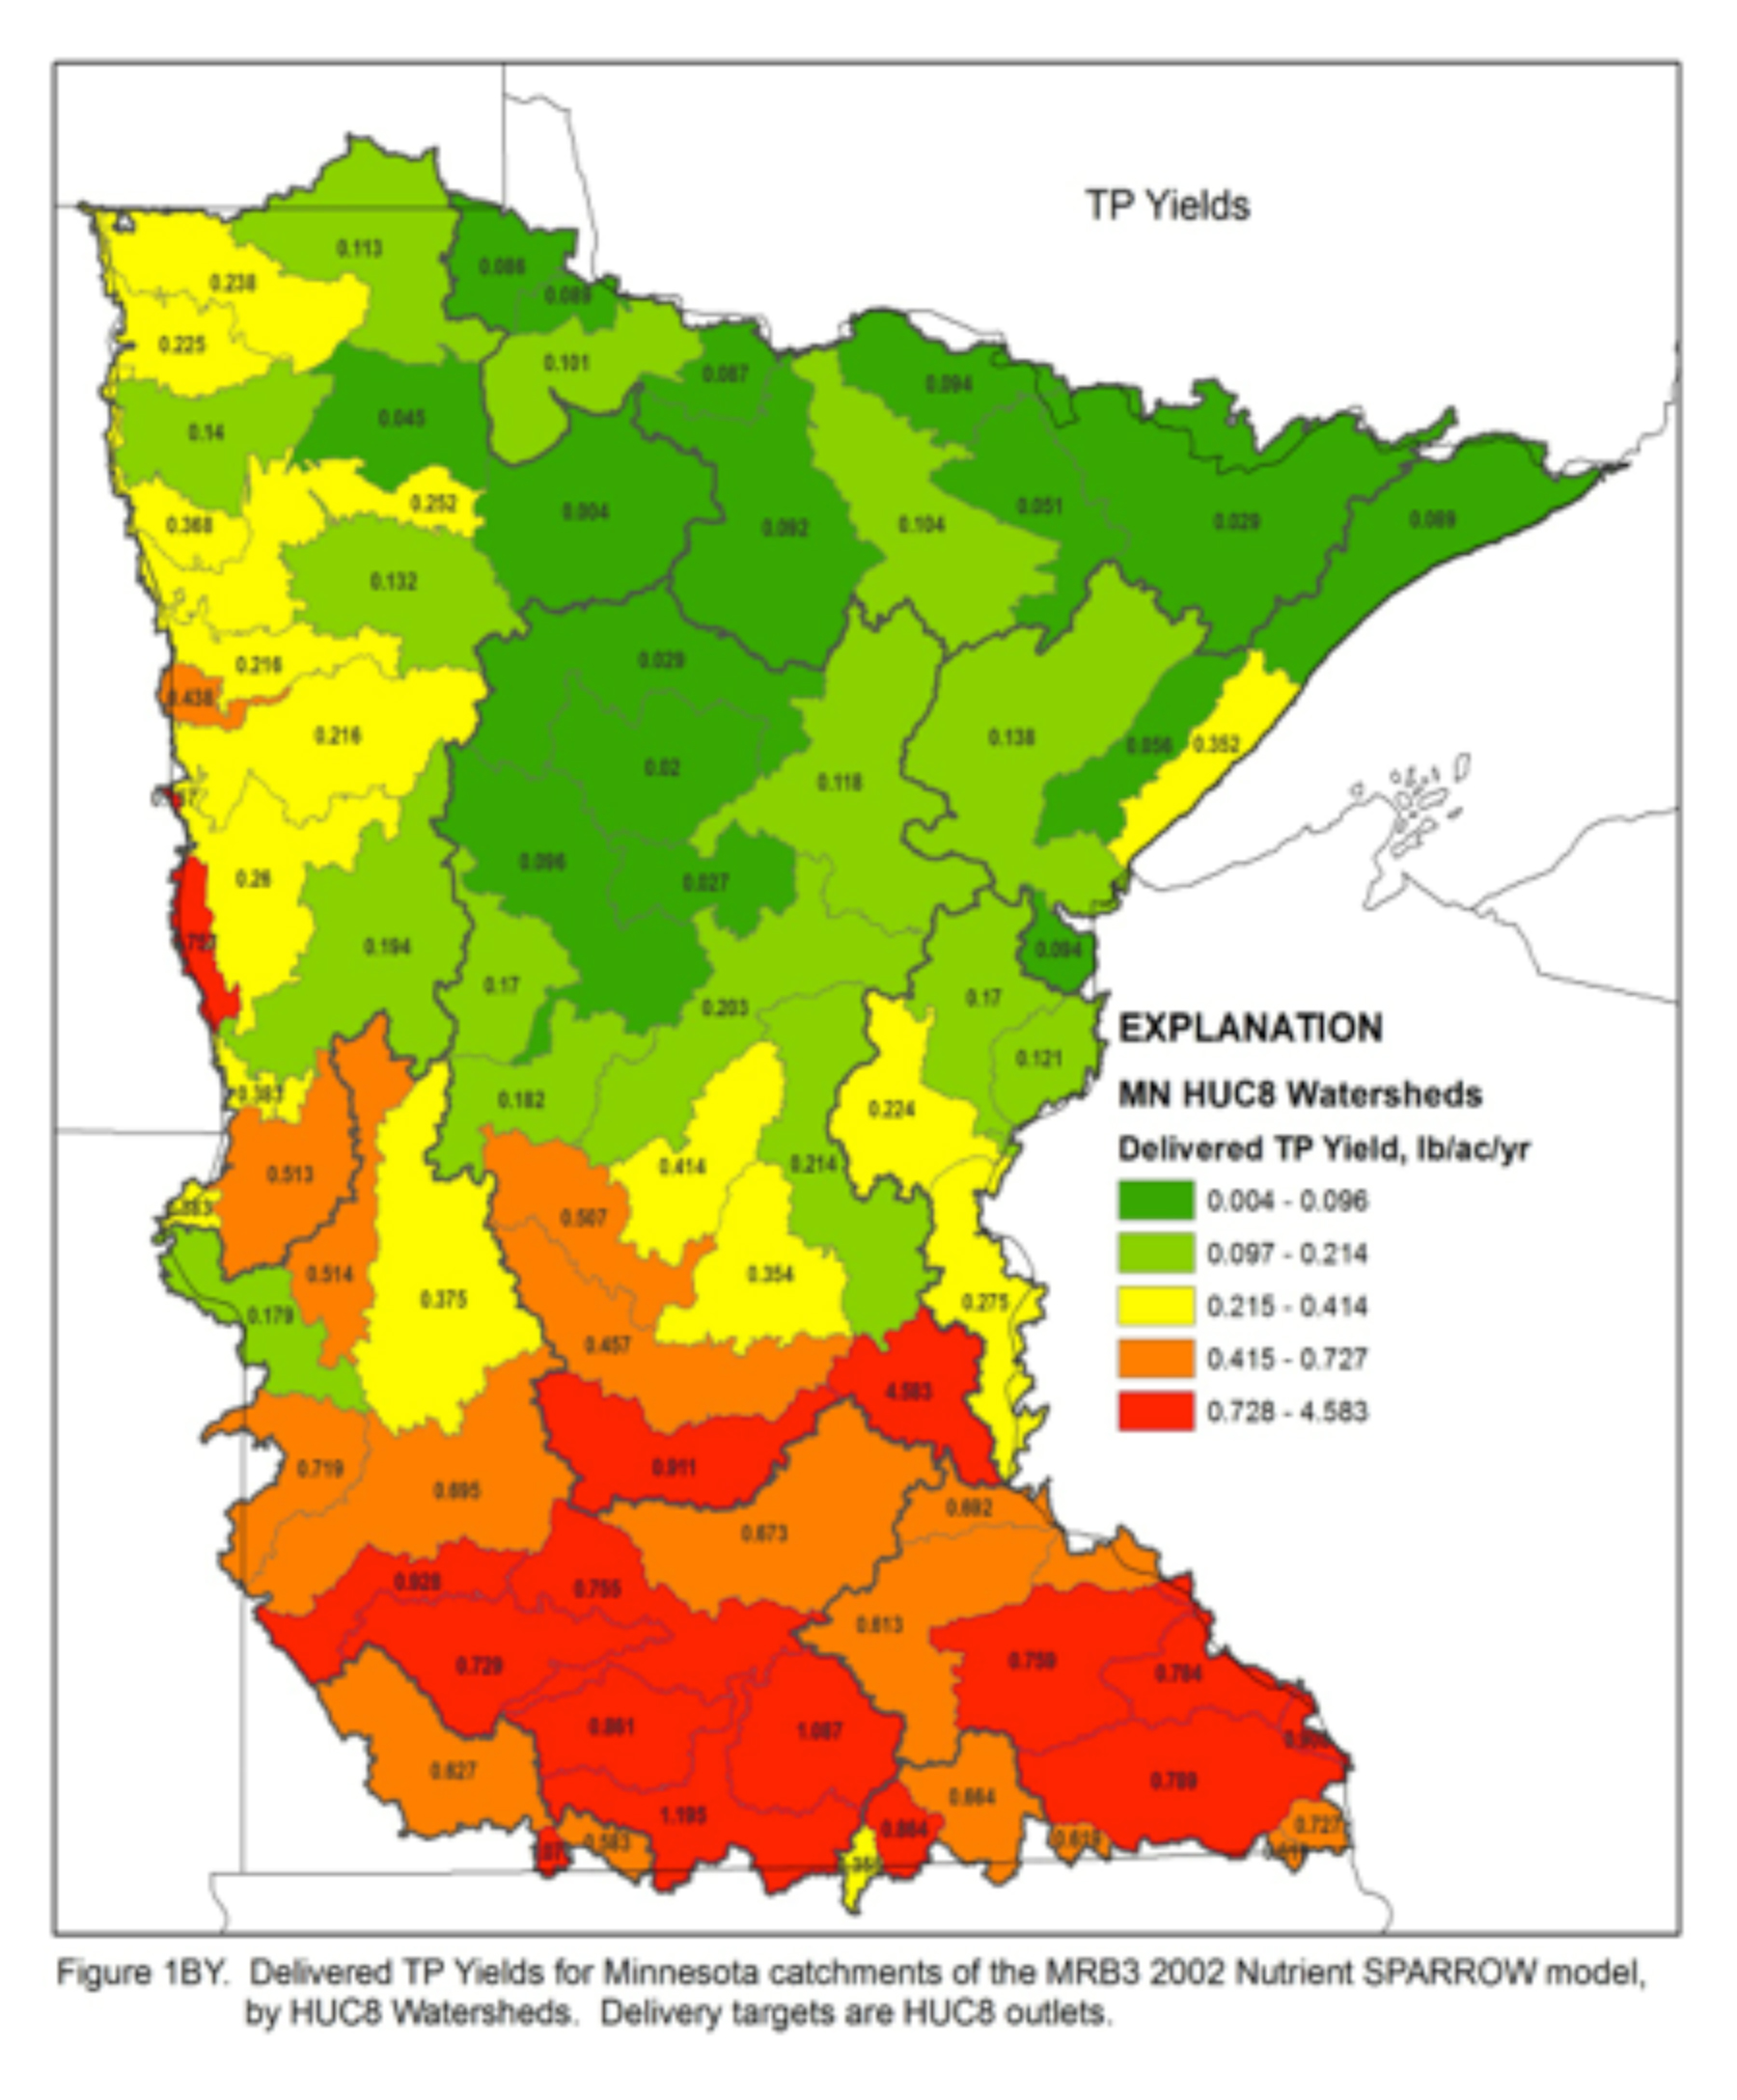
The SPAtially Referenced Regressions on Watershed attributes (SPARROW) model, developed and maintained by the United States Geological Survey (USGS), was used for the Minnesota Nutrient Reduction Strategy to estimate Total Phosphorus (TP) loads, yields, and flow-weighted mean concentrations (FWMC) in Minnesota 8-digit Hydrologic Unit Code (HUC8) watersheds and major basins.
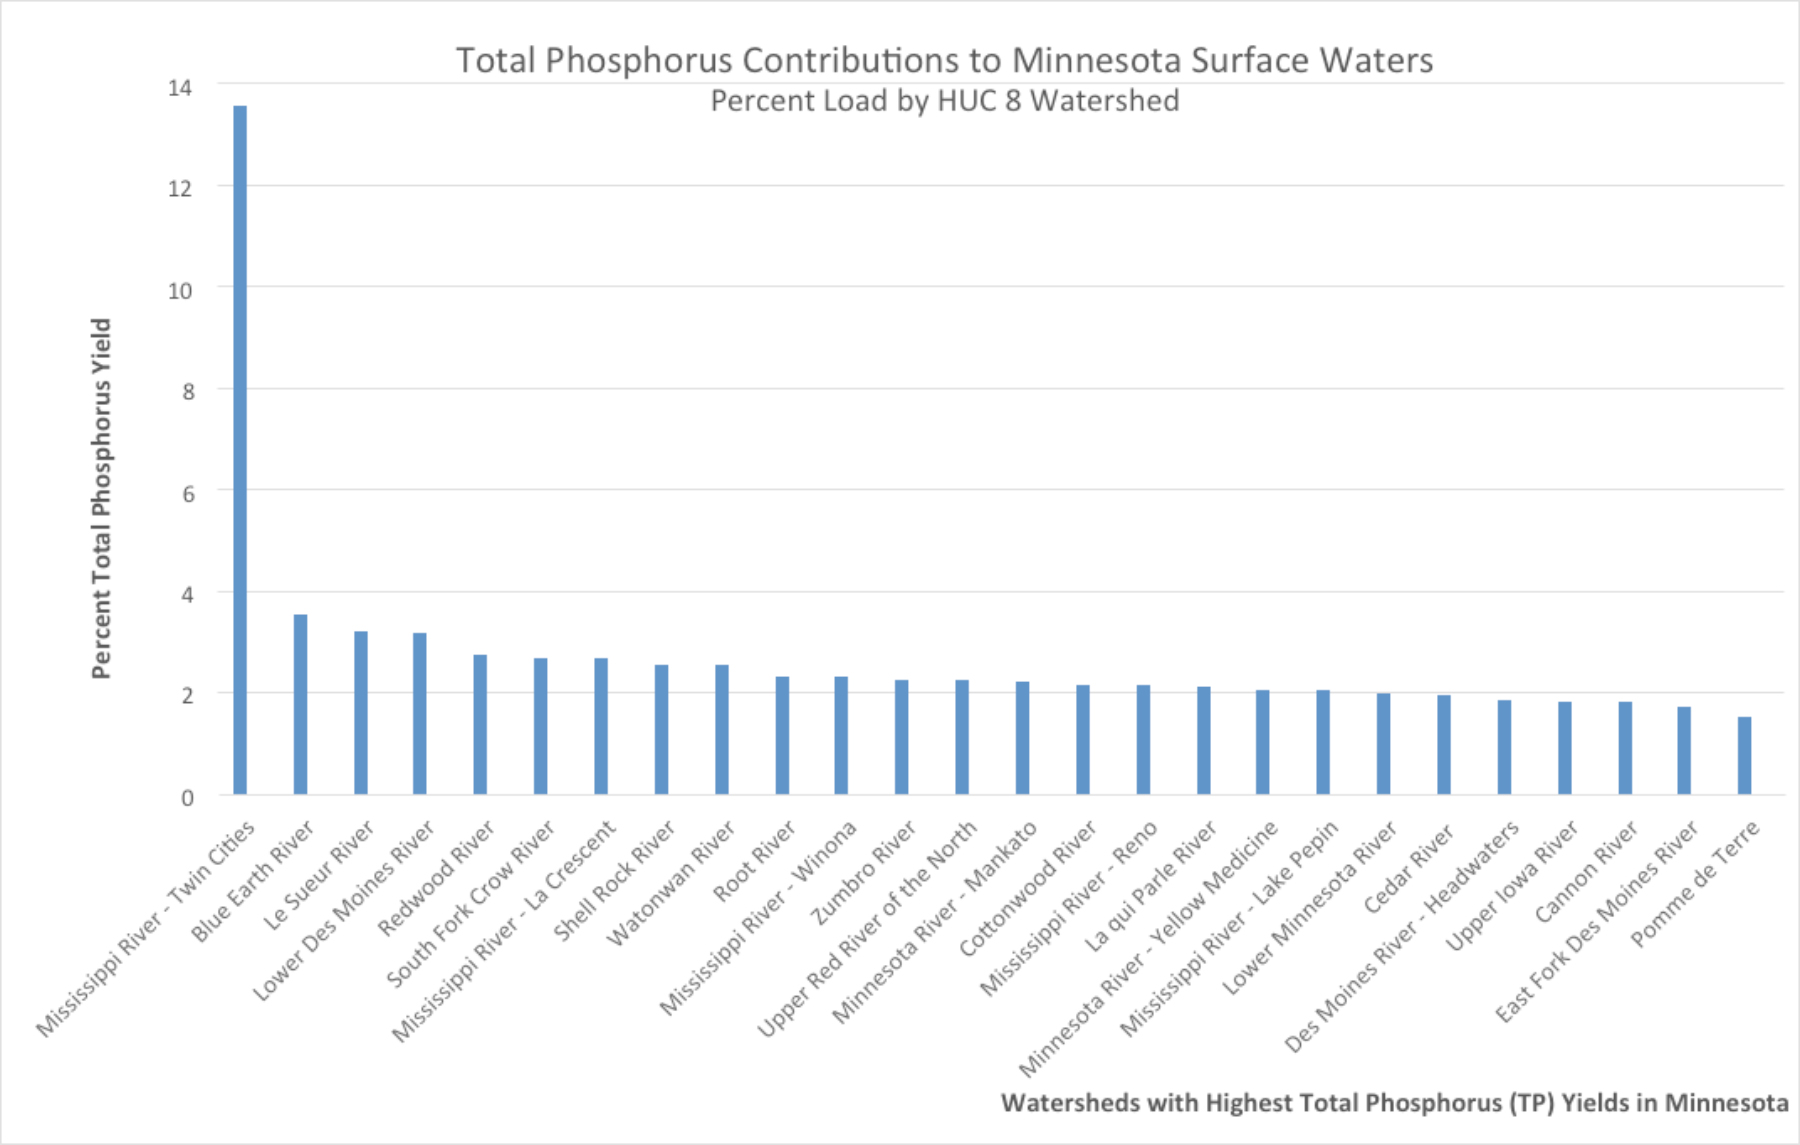
Modeling Total Phosphorus Yield (lb/ac/yr)
 |
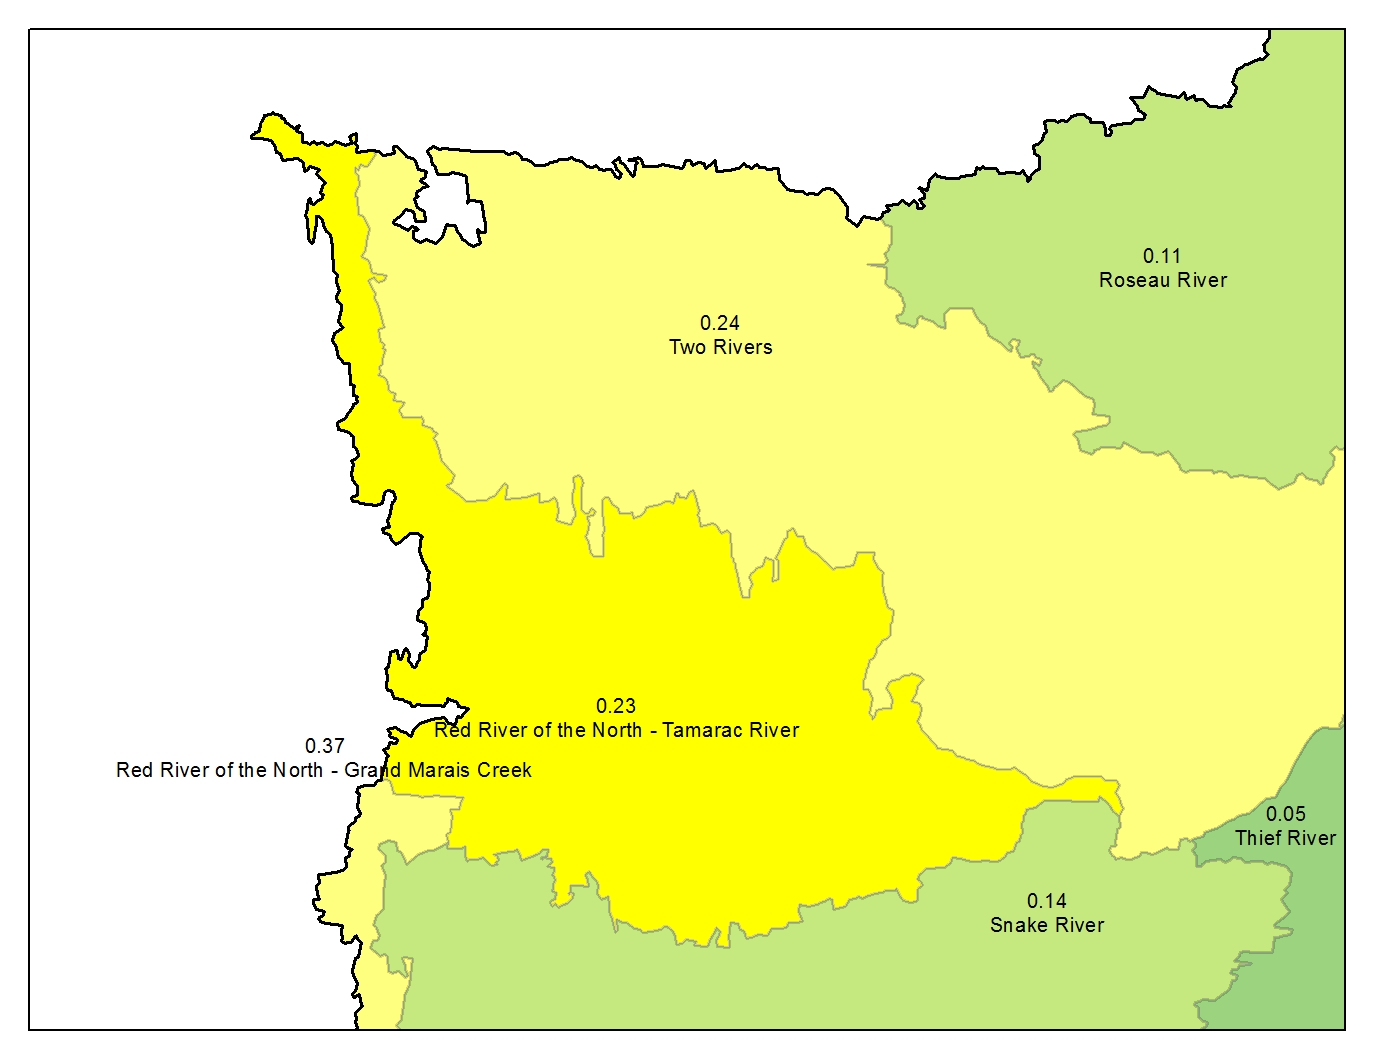 |
Source: Minnesota Nutrient Reduction Strategy (2013)
Statewide
Implementation of MPCA’s Phosphorus Strategy and Minnesota Rule Chapter 7053.0255 has resulted in significant wastewater effluent phosphorus load reductions since the year 2000.
Statewide Wastewater Phosphorus Effluent Loading

Source: Minnesota Nutrient Reduction Strategy, Chapter 5: Point and Nonpoint Source Reductions
Municipal and Industrial Wastewater Phosphorus Trends & Projections
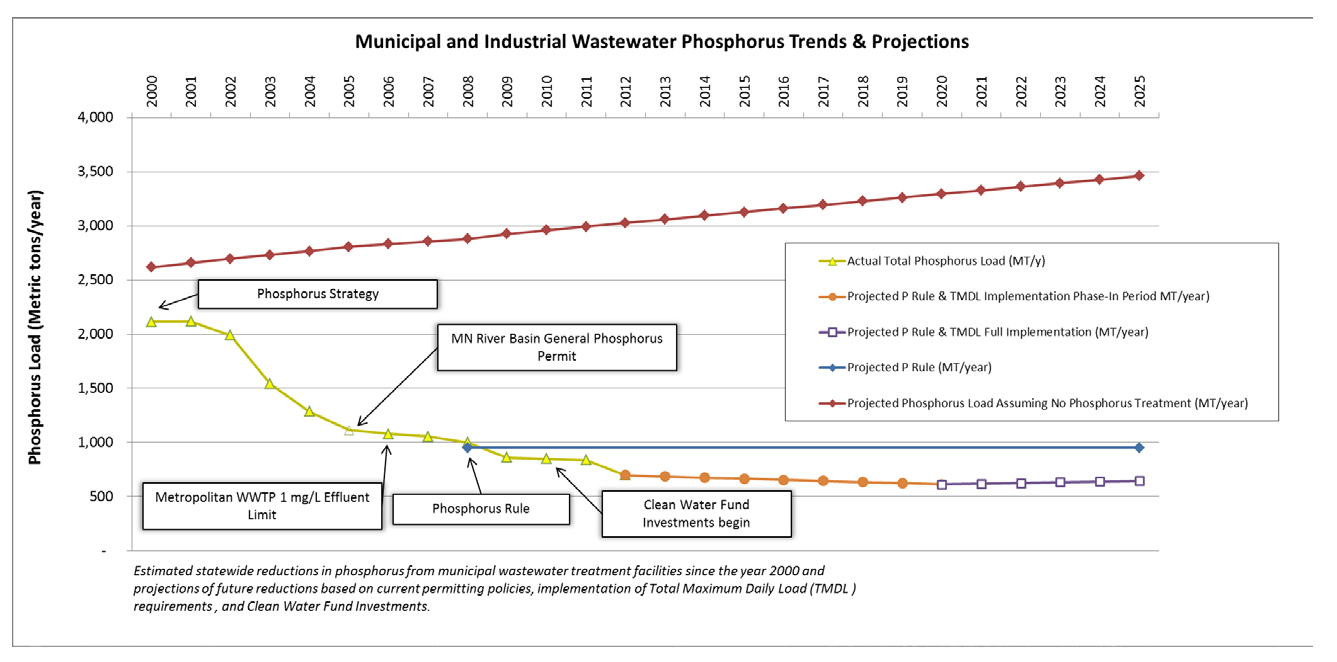
Source: Minnesota Nutrient Reduction Strategy, Chapter 4: Management Priorites and Recent Progress
Summary of Recent Progress in Phosphorus Source Loads by Major Basin
Efforts between 2000 and present have resulted in significant progress in reducing phosphorus loads in the Mississippi River Basin, due to both agricultural BMPs and wastewater treatment plant upgrades.
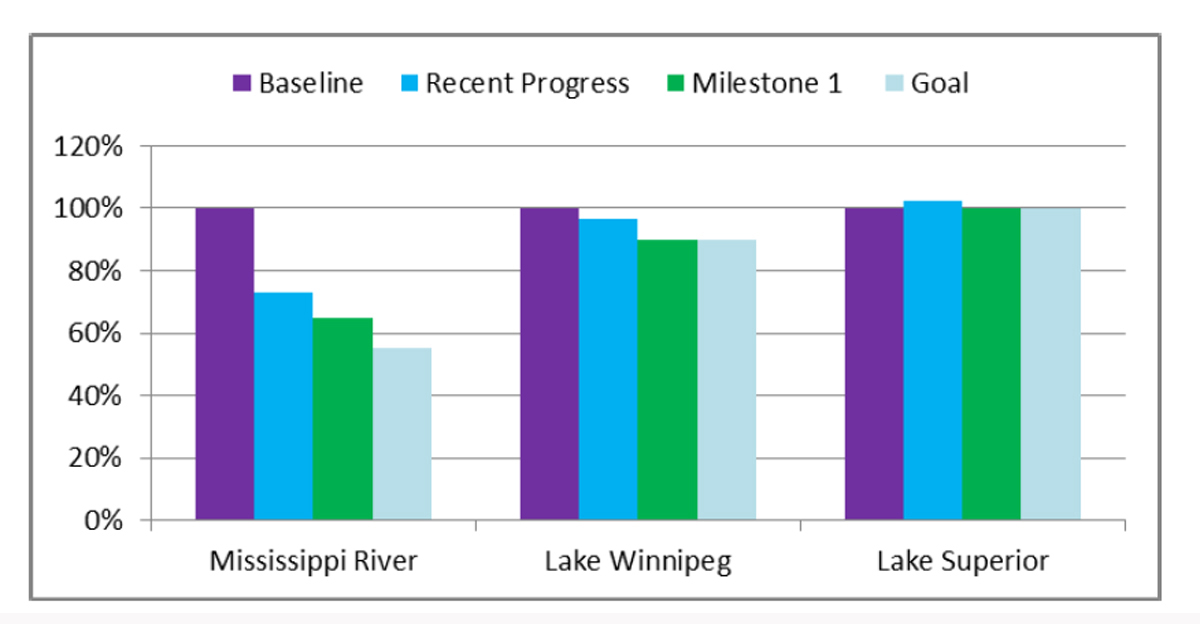
Source: Minnesota Nutrient Reduction Strategy, Chapter 4: Management Priorites and Recent Progress
Notes: Recent progress is the percent of baseline load remaining after accounting for reductions since 2000.
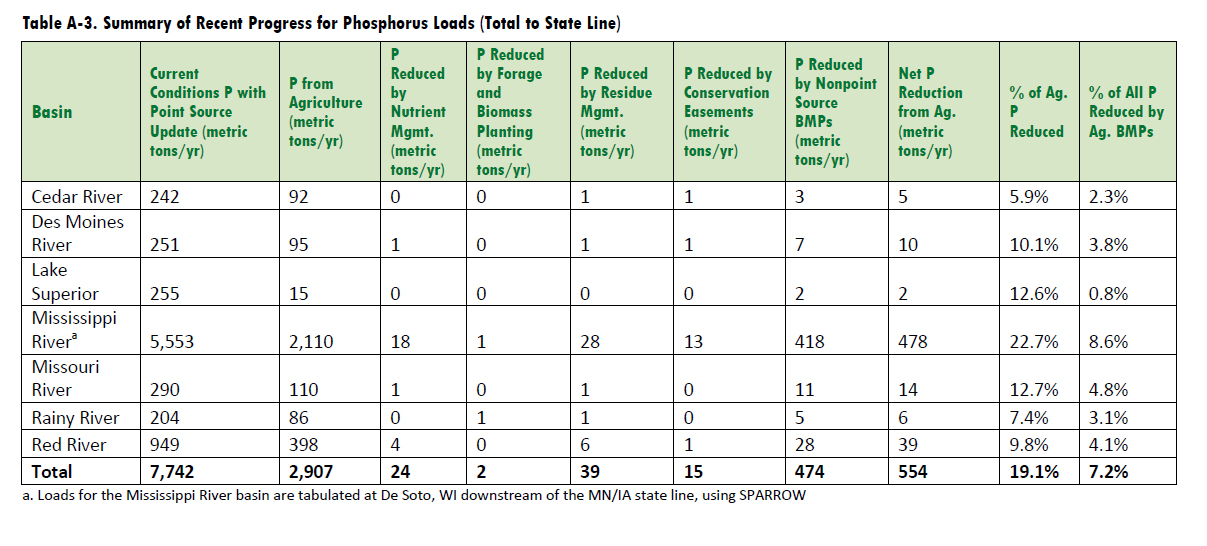
Source: Minnesota Nutrient Reduction Strategy, Appendix A
Assessed Lakes (2012) in the Red River of the North Tamarac Watershed
Impairment Parameters:
Nutrients = Nutrients
HgF = Mercury in Fish Tissue
HgW = Mercury in Water Column
CL = Chloride
PCBF = PCBs in Fish
PFOS = Perfluorooctane Sulfonate (PFOS) in Fish Tissue
Affected Uses:
AQC = Aquatic Consumption
AQR = Aquatic Recreation
AQL = Aquatic Life
| Lake Name | County Name | Impairment Parameters | Affected Uses | MN DNR Lake Finder | Minnesota Pollution Control Agency |
| Florian Park Reservoir | Marshall County | HgF | AQC | Lake Profile: 45011900 | Water Quality Profile: 45-0119-00 |
Source: Minnesota Pollution Control Agency Assessed Waters (2012) & Impaired Waters (2012)
Statewide Impaired Lakesheds
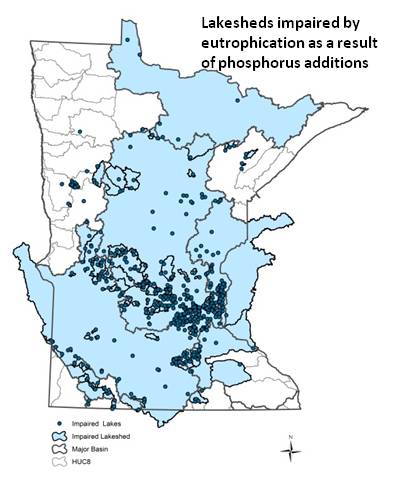
Source: Minnesota Nutrient Reduction Strategy, Chapter 2 Setting Goals and Milestones (2013)
For more information about what you can do to protect area lakes, visit MPCA's Lake protection and management website.
Vertical Tabs
 Watershed Contacts - MPCA
 Local Government Units and Partner Agencies - BWSR
Watershed Contacts
Denise Oakes, P.G., Pollution Control Specialist Senior
MPCA Detroit Lakes Office
(218)846-8119
denise.oakes@state.mn.us
 The Minnesota Nutrient Reduction Strategy - MPCA
Driving forces and building blocks for the Nutrient Reduction Strategy
 Hypoxia Action Plan
 Clean Water Land & Legacy Amendment
 Minnesota Watershed Approach
 Groundwater Proection and Nitrogen Fertilizer Management Plan
![]() Minnesota Water Sustainability Framework
Minnesota Water Sustainability Framework
 Detailed Assessment of Phosphorus Sources to Minnesota Watersheds
 Nitrogen in Minnesota Surface Waters
 Modeled Nitrogen Loads (SPARROW)
 Watershed Pollutant Load Monitoring - MPCA
Long Term Water Quality Monitoring -  USGS,
USGS,  Met Council,
  Manitoba
Red River Basin
Red River of the North Basin (MPCA)
HSPF Modeling: Mustinka and Bois de Sioux Watersheds Phase III (2012-2013)
Red River Basin Water Quality Decision Support Application (WQDSA) (2012-2014)
Red River of the North Watershed Runoff Reduction (2012-2014)
Water Quality Improvement for Clay County Ditches (2013-2015)
Buffalo-Red River Watershed District
BRRWD Projects
Buffalo-Red River Watershed District Revised Watershed Management Plan (2010)
Buffalo River Watershed Approach Plan II (2011-2013)
Wolverton Creek Restoration (2011-2013)
Buffalo-Red Watershed Sediment Reduction (2012-2014)
Buffalo-Red River Shallow Lakes Restoration Project (2013-2015)
Upper South Branch BMP Strategic Implementation Plan – Part II (2013-2015)
Middle-Snake-Tamarac Rivers Watershed District
MSTRWD Projects
Red River Watershed Management Board
RRWMB Reports
Red River Basin Commission
RRBC Natural Resources Framework Plan
RRBC Projects
RRBC Reports
RRBC Nutrient Capture through Water Management and Biomass Harvesting (2013)
Red River of the North – Tamarac River Watershed
Watershed Restoration and Protection (MPCA)
Red River of the North – Tamarac River Major Watershed WRAP Strategy (MPCA)
Rapid Watershed Assessment: Lower Red (NRCS)
Lower Red River of the North Watershed Monitoring and Assessment Report (2013)
Joe River Watershed District
JRWD Office
Kittson County
County Zoning
SWCD Programs
SWCD Reports & Publications
Kittson County Local Water Management Plan 2010-2019
Marshall County
County Water & Land Office
SWCD Accomplishments
SWCD Programs
SWCD Plans & Reports
SWCD Services
Marshall County Local Water Management Plan 2007-2015
Roseau County
County Environmental Office
SWCD Plans
SWCD Programs
SWCD Reports
Roseau County Local Water Management Plan 2010-2019
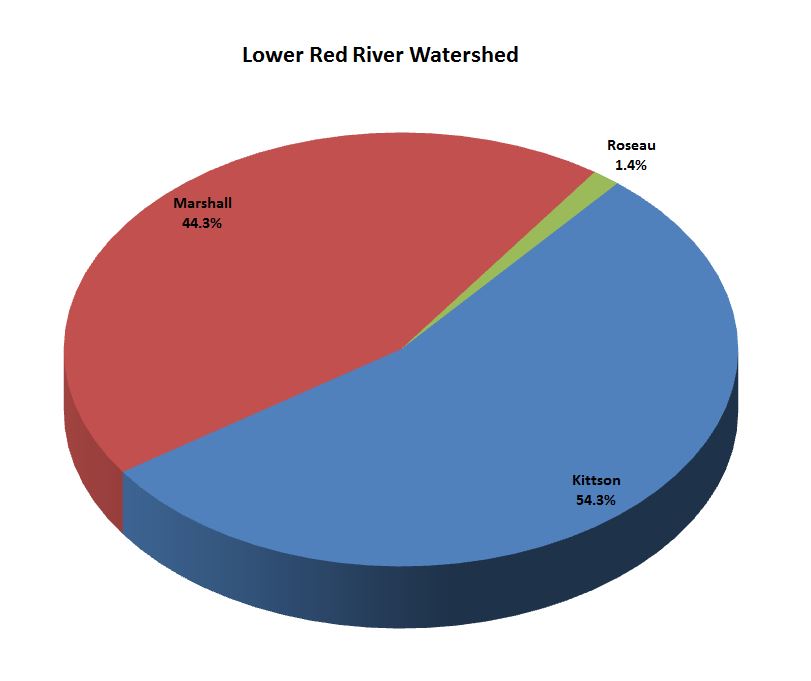
Lower Red River Watershed
Percent of County in Watershed
Water Plan Links
 Kittson County LWMP 2010-2019
 Marshall County LWMP 2007-2015 amended 2012
 Roseau County LWMP 2010-2020
Local Water Management Overview
 County Comprehensive Local Water Management - BWSR
Minnesota Nutrient Strategy Overview
![]() Nitrogen Science
Nitrogen Science
![]() Strategies for Nutrient Reduction - Wastewater
Strategies for Nutrient Reduction - Wastewater
Planning Tools
 Minnesota Watershed Nitrogen Reduction Planning Tool - Nitrogen BMP Spreadsheet (Lazarus et al., 2013)
Nitrogen Priority Watersheds & Reduction Milestone
 The Minnesota Nutrient Reduction Strategy - MPCA
Excerpts from ![]() Chapter 4: Management Priorities and Recent Projects
Chapter 4: Management Priorities and Recent Projects
Nitrogen Priority Watersheds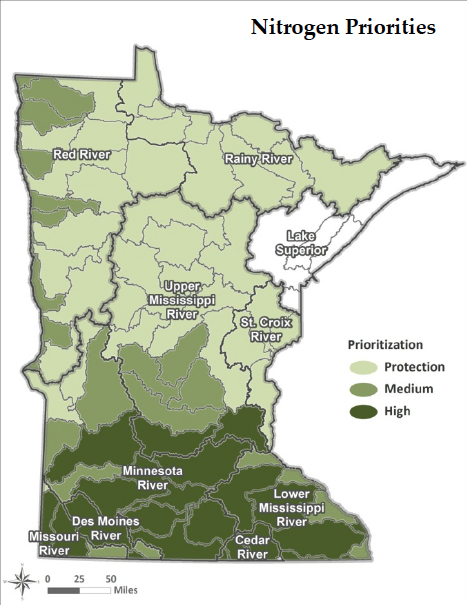 |
Reduction Milestone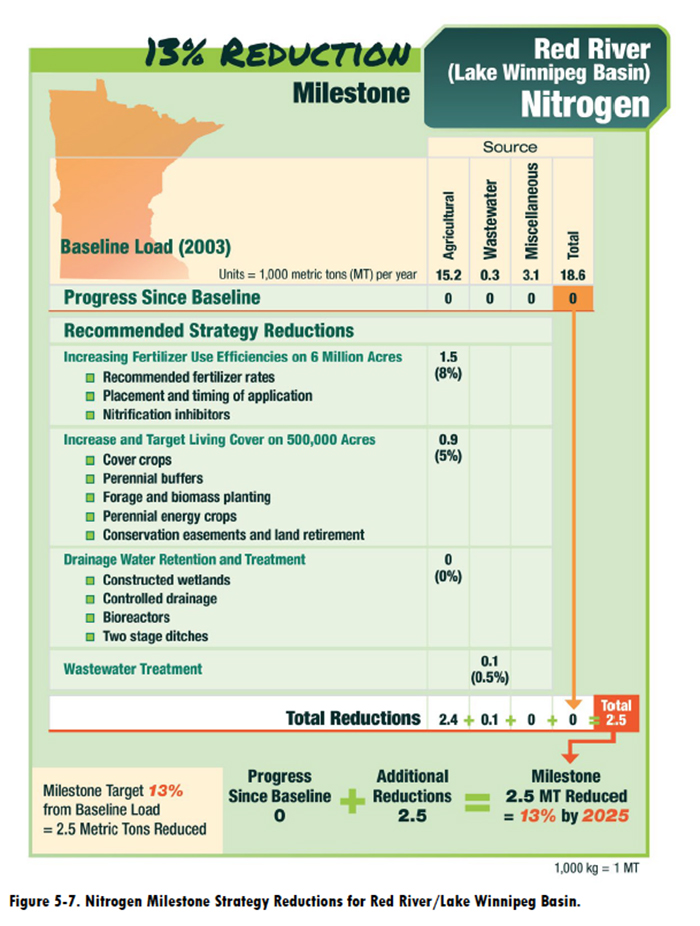 |
Source: The Minnesota Nutrient Reduction Strategy, Chapter 4: Management Priorities and Recent Projects (2013)
Priority Sources
Priority sources are determined on a basin scale, although it should be noted that different sources may be more or less important at the local scale. Priority sources at the HUC8 scale or smaller will be determined through watershed planning efforts at that scale.
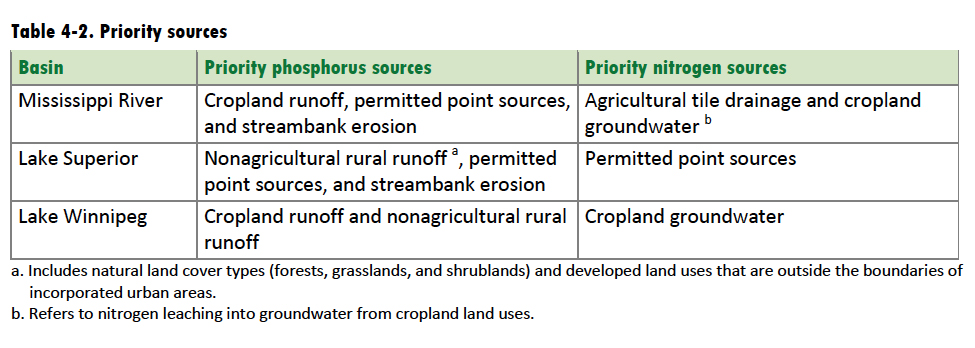
Source: The Minnesota Nutrient Reduction Strategy, Chapter 4: Management Priorities and Recent Projects (2013)
Example BMP Scenario for Nitrogen Reduction
 The Minnesota Nutrient Reduction Strategy - MPCA
Excerpts from ![]() Chapter 5: Point and Nonpoint Source Reductions
Chapter 5: Point and Nonpoint Source Reductions
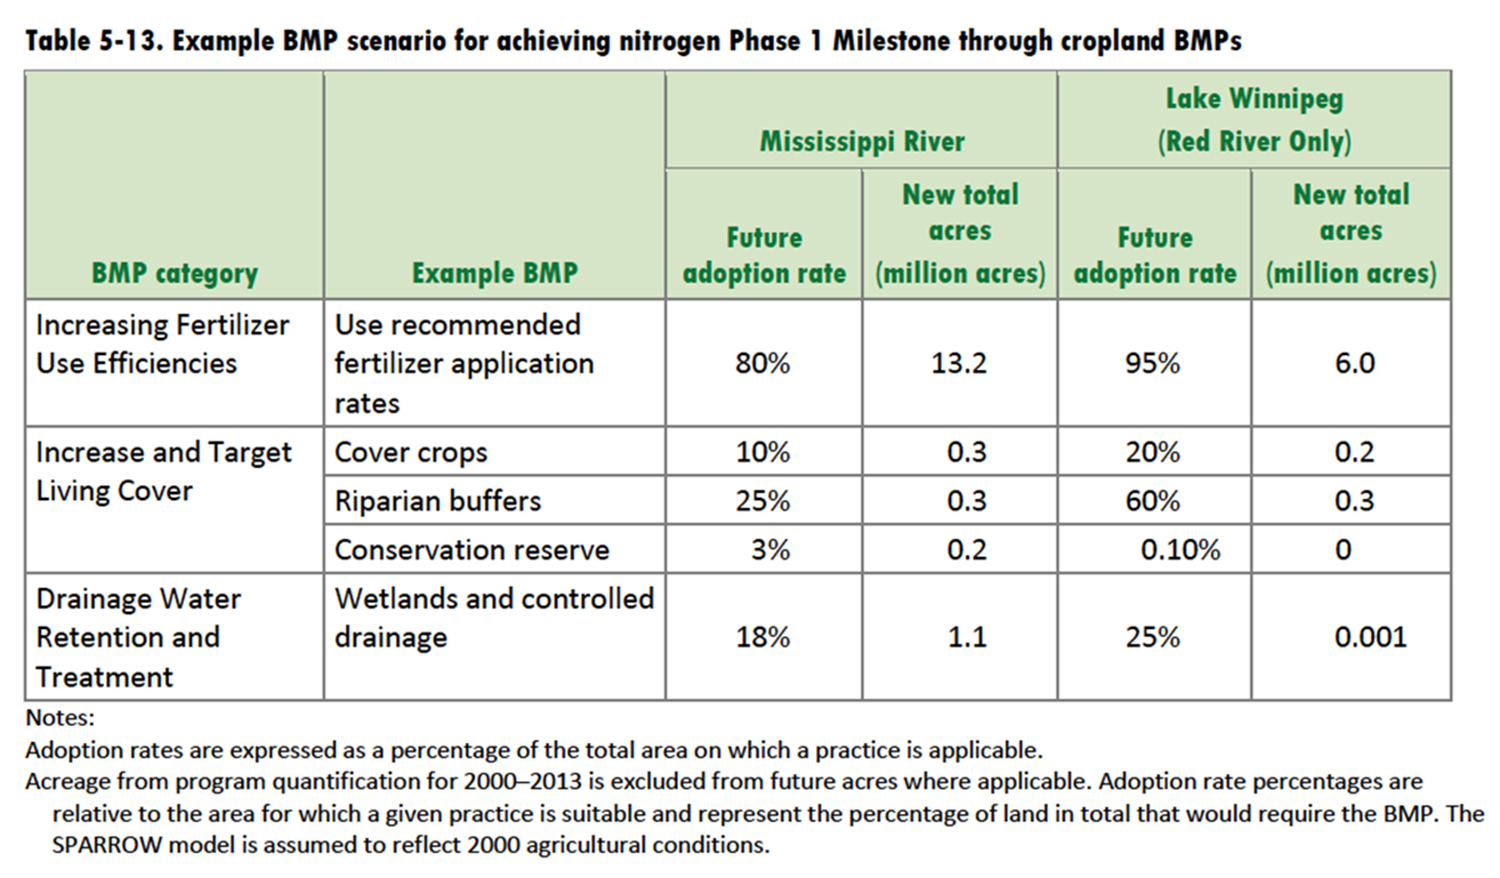
Source: The Minnesota Nutrient Reduction Strategy, Chapter 4: Management Priorities and Recent Projects (2013)
See "Economics" Tab for a Watershed BMP Nitrogen Reduction Scenario.
Minnesota Nutrient Strategy Overview
![]() Phosphorus Science
Phosphorus Science
![]() Strategies for Nutrient Reduction - Wastewater
Strategies for Nutrient Reduction - Wastewater
Phosphorus Priority Watersheds & Reduction Milestone
 The Minnesota Nutrient Reduction Strategy - MPCA
Excerpts from ![]() Chapter 4: Management Priorities and Recent Projects
Chapter 4: Management Priorities and Recent Projects
Phosphorus Priority Watersheds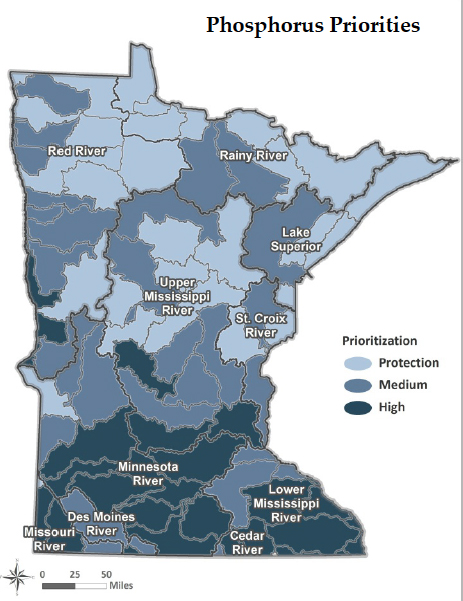 |
 |
Source: The Minnesota Nutrient Reduction Strategy (2013)
Priority Sources
Priority sources are determined on a basin scale, although it should be noted that different sources may be more or less important at the local scale. Priority sources at the HUC8 scale or smaller will be determined through watershed planning efforts at that scale.

Source: The Minnesota Nutrient Reduction Strategy, Chapter 4: Management Priorities and Recent Projects (2013)
Agricultural BMPs
Example BMP scenario for Phosphorus Reduction
 The Minnesota Nutrient Reduction Strategy - MPCA
Excerpts from ![]() Chapter 5: Point and Nonpoint Source Reductions
Chapter 5: Point and Nonpoint Source Reductions
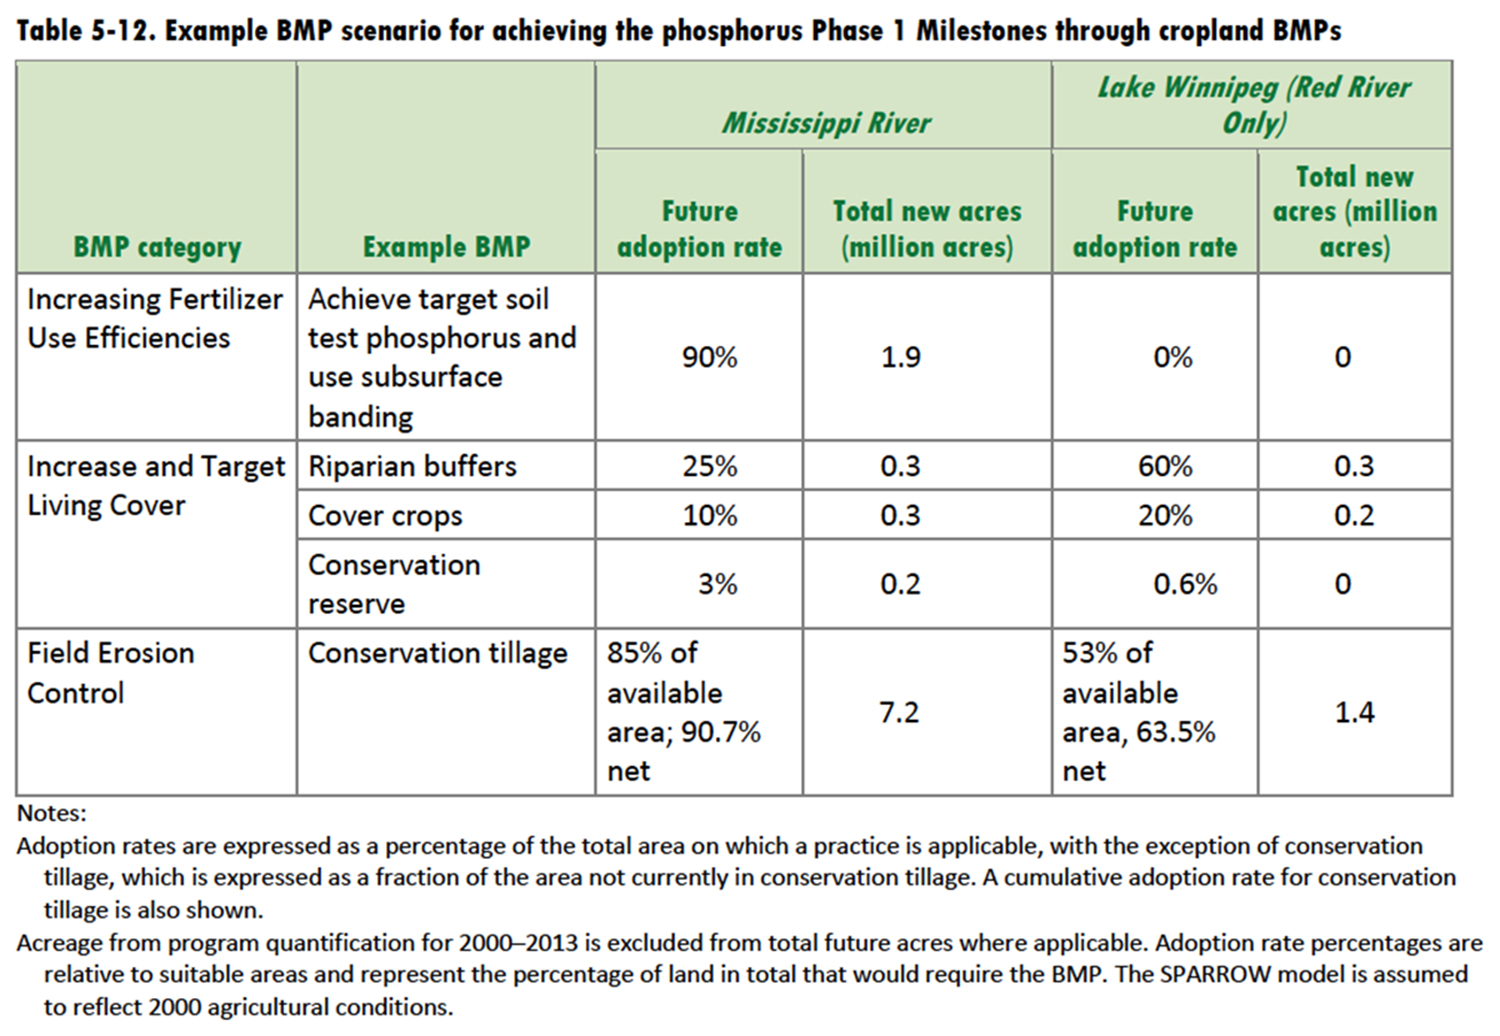
Source: The Minnesota Nutrient Reduction Strategy, Chapter 5: Point and Nonpoint Source Reductions (2013)
Watershed Summary
 Rapid Watershed Assessment Resource Profile: Lower Red - NRCS
Conservation Practices
 Conservation Implementation - BWSR
 Conservation Easements - BWSR
 Interactive Conservation Easement Map RIM - BWSR
 Conservation Practices - MDA
BMP Summary
Excerpts from  The Minnesota Nutrient Reduction Strategy - MPCA
![]() Chapter 5 - Point and Nonpoint Source Reductions
Chapter 5 - Point and Nonpoint Source Reductions
![]() Appendix C - Agricultural BMPs
Appendix C - Agricultural BMPs
Because agricultural sources contribute the bulk of the statewide nitrogen load and a substantial portion of the phosphorus load, nitrogen and phosphorus reductions from agricultural sources are key to successfully achieving the milestones. Recommended agricultural BMPs and strategy options for promoting adoption of the BMPs to address phosphorus and nitrogen are provided in the links above.
Phosphorus: Based on the SPARROW model and the source attributions developed in the Detailed Assessment of Phosphorus Sources to Minnesota Watersheds (Barr Engineering 2004), agricultural sources contribute an estimated 38 percent of the statewide phosphorus load. A large part of the remaining phosphorus load is due to stream channel erosion, much of which is indirectly affected by agricultural runoff and intensive drainage practices (Schottler et al. 2013).
Nitrogen: Based on the Nitrogen in Minnesota Surface Waters study (MPCA 2013), agriculture contributes 73 percent of the statewide nitrogen load in a typical year.
See "Strategy - N Reduction" and "Strategy - P Reduction" Tabs for example BMP Scenarios for Nitrogen and Phosphorus Reduction
 Minnesota Watershed Nitrogen Reduction Planning Tool - Nitrogen BMP Spreadsheet (Lazarus et al., 2013)
 Minnesota Nutrient Reduction Strategy SPARROW - (MPCA, 2013)
 GSSHA Model – Agricultural Water Certification Program – GSSHA Model – (MDNR, In Progress)
 Red River Basin Decision Information Network - Tools
A core RRBDIN service to basin residents and resource managers is to provide decision support “tools” designed to disseminate important and relevant information to aid in local, state, and regional decision-making.
 Hydrology Models: HEC-HMS models for tributaries within the Red River of the North basin to assist in development and analysis of future flood damage reduction projects
 Red River Basin Commission - Mainstem Modeling
 USDA-NRCS Nutrient Tracking Tool – Tarleton State (Texas Example)
NTT estimates the nutrient and sediment load leaving a farm field through surface water runoff and leaching below the rooting zone and can be used to quantify the water quality benefits of different agricultural management systems and conservation practices. Designed and developed by the USDA Natural Resources Conservation Service (NRCS), USDA Agricultural Research Service (ARS), and Texas Institute for Applied Environmental Research at Tarleton State University (TiAER), NTT is intended for use by agricultural professionals or others familiar with farm procedures and conservation practices.
 Ag BMP Assessment and Tracking Tool – Houston Engineering
Solutions for improving impaired waters often rely on the use of agricultural best management practices (BMPs). The goal of this project is to collect and disseminate thorough and accurate information on the use and effectiveness of agricultural BMPs in the State of Minnesota. Stakeholders can use this information to inform, mock-up and track their BMP implementation strategies.
 AG BMP Database - Houston Engineering
The goal of the Ag BMP Database is to provide a comprehensive source of information on the application and effectiveness of agricultural BMPs within the State of Minnesota. The database was developed to hold information on BMPs that are commonly used in the State to address water quality impairments for: sediment, nitrogen, phosphorus, and bacteria.
Ecological Ranking Tools
 Watershed Health Assessment Framework - MDNR
The Watershed Health Assessment Framework (WHAF) provides a comprehensive overview of the ecological health of Minnesota's watersheds. By applying a consistent statewide approach, the WHAF expands our understanding of processes and interactions that create healthy and unhealthy responses in Minnesota's watersheds. Health scores are used to provide a baseline for exploring patterns and relationships in emerging health trends.
 Ecological Ranking of Parcels for Prioritizing Conservation Activities – NRRI
This site provides a mapping tool by which natural resource managers can visualize and interact with a high resolution map of the spatial data layers. Managers have the ability to specify the relative importance of habitat, soil erosion potential, or other components of the Environmental Benefits Index - a score which represents a summary of the above factors., and view how the ecological ranking of parcels changes under different scenarios.
http://beaver.nrri.umn.edu/EcolRank/
FUNDING GUIDES
 Conservation Practices - Funding Guide, MDA
This Minnesota Department of Agriculture website provides an overview of financial and technical assistance for nutrient management.
 Conservation Funding Guide: Practice & Payment Information, MDA
On this Minnesota Department of Agriculture website, you can select a conservation practice and compare payments.
COST ANALYSIS PLANNING TOOLS
Minnesota Watershed Nitrogen Nitrogen Reduction Planning Tool
 Minnesota Watershed Nitrogen Reduction Planning Tool - Nitrogen BMP Spreadsheet (Lazarus et al., 2013)
The Watershed Nitrogen Reduction Planning Tool (Excel Spreadsheet) was developed as part of the Nitrogen in Minnesota Surface Waters Study by researchers at the University of MInnesota and Minnesota Pollution Control Agency. The project purpose was to develop a framework for a watershed nitrogen planning aid that could be used to compare and optimize selection of "Best Management Practices" (BMPs) for reducing the nitrogen load from the highest contributing sources and pathways in the watershed.
 Overview of Nitrogen Reduction Planning Tool
![]() NBMP Tool - Maps
NBMP Tool - Maps
![]() NBMP Spreadsheet (Excel)
NBMP Spreadsheet (Excel)
Cost Analysis of Minnesota Nutrient Reduction Strategy
An analysis of costs is provided in Chapter 5.5 of the Minnesota Nutrient Reduction Strategy for both wastewater nutrient removal and agricultural BMP implementation.
Excerpts from ![]() Chapter 5: Point and Nonpoint Source Reductions
Chapter 5: Point and Nonpoint Source Reductions
![]() Appendix C: Program Recommendations
Appendix C: Program Recommendations
Wastewater
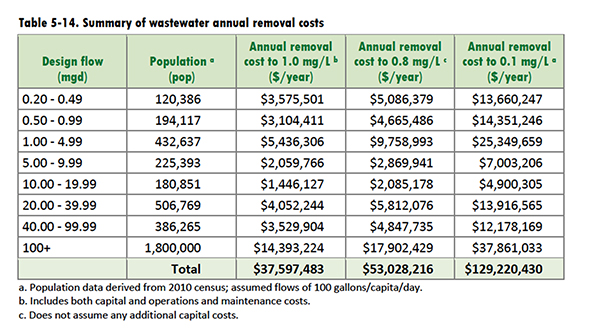
Source: Minnesota Nutrient Reduction Strategy, Chapter 5: Point and Nonpoint Source Reductions (2013)
Agricultural BMPs
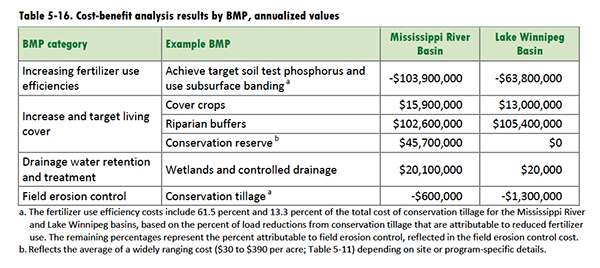
Source: Minnesota Nutrient Reduction Strategy, Chapter 5: Point and Nonpoint Source Reductions (2013)

