This long and relatively narrow watershed spans three counties and varies
greatly in terms of the physical landscape, soils, and amount of annual
rainfall.
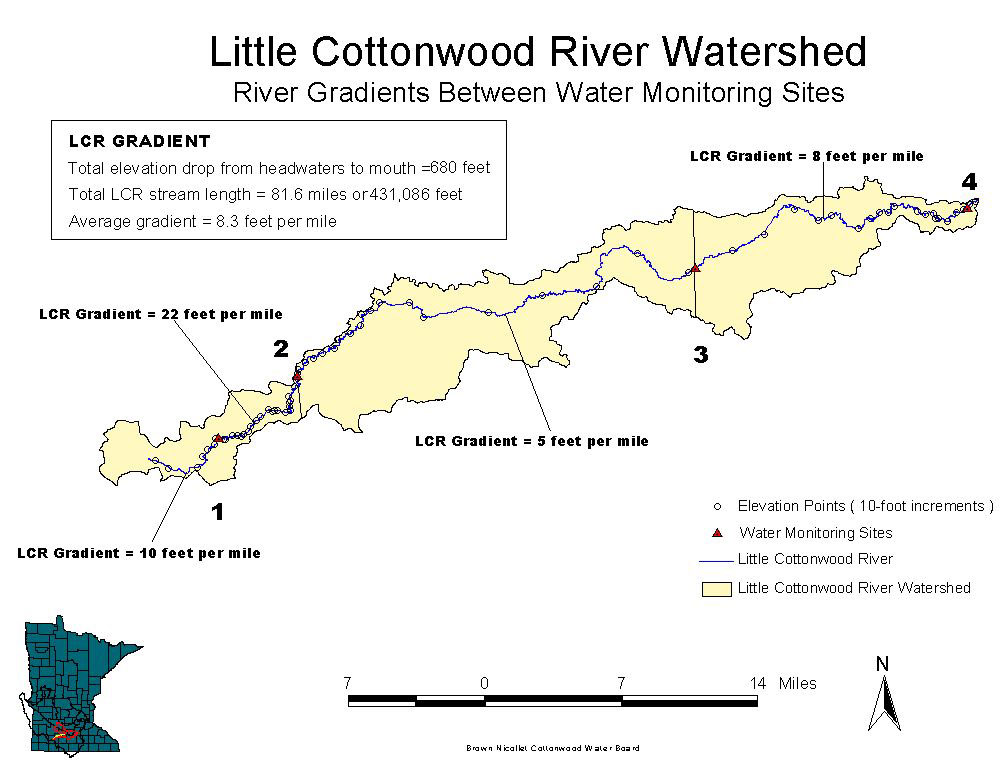
The middle portion is nearly flat with a river gradient of only five feet
per mile (see the river profile and
river gradient map). This relatively
flat gradient is different from the steep upper and lower reaches of the
watershed. Generally, the upper, western portion of the watershed is drier
and receives four inches or less rainfall per year on average than the
lower portion of the watershed (precipitation
map).
In the middle watershed, the river widens, slows down, and meanders through
a large floodplain with vast areas of grasslands, wetlands, and pastures.
Nitrogen and phosphorus are often reduced by more than 50 percent in this
stretch of the river because of the natural filtering processes common
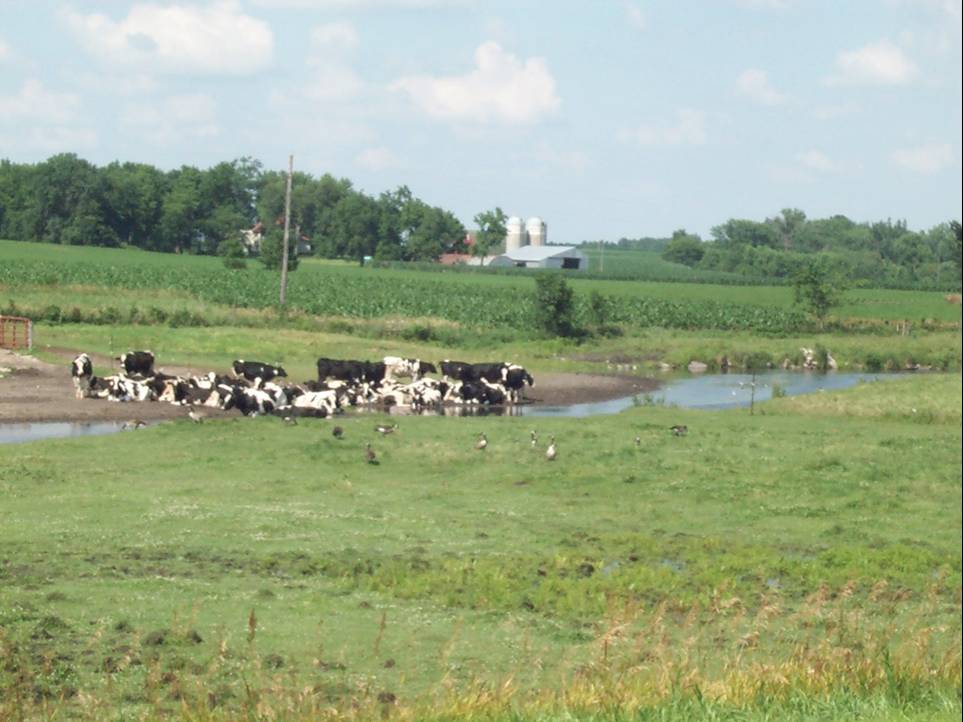
in these types of environments. However, fecal coliform bacteria levels
are highest in this area (near Monitoring Site #3). The high bacteria
levels may be due to the number of feedlots in this area, as well as the
open access that livestock have to the river because much of the floodplain
is used as pasture.
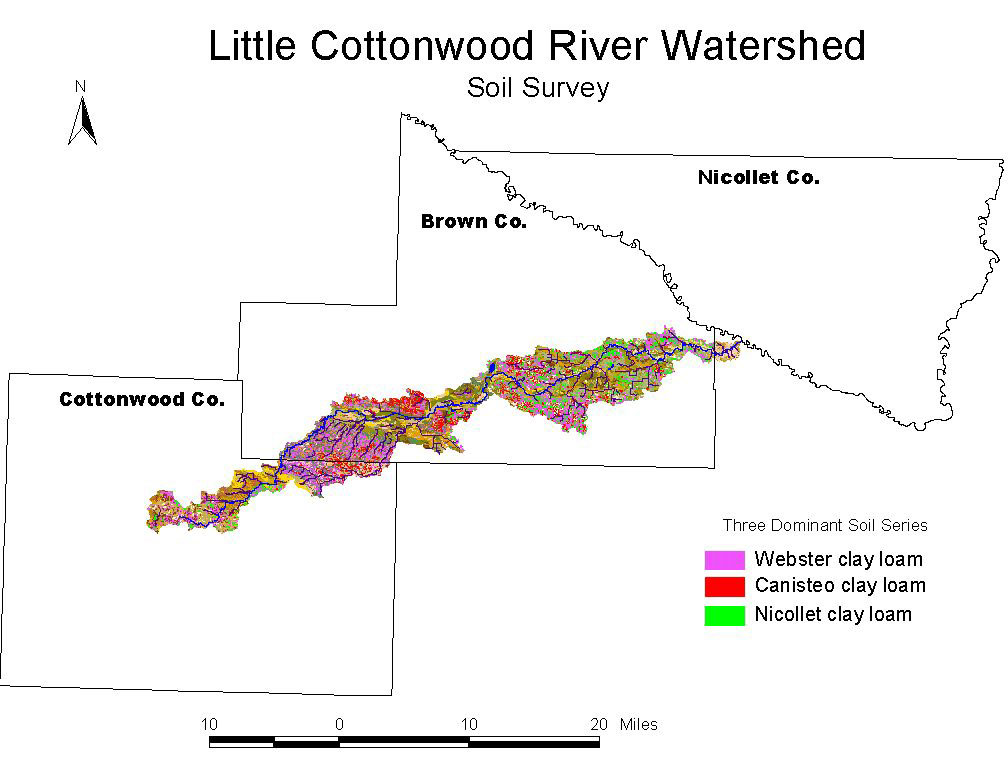
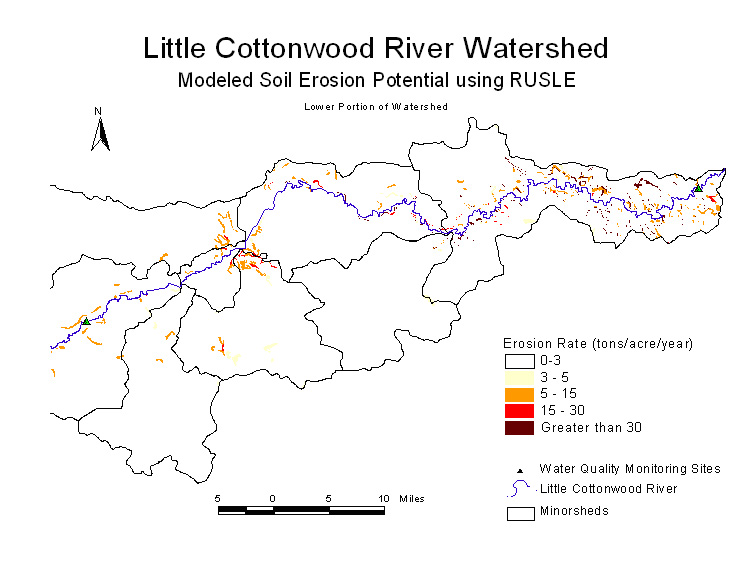
Soils also vary across the watershed. (See the soil
survey map, and soil erosion potential maps: (upper,
middle, lower),
which illustrate this variability. Next

tour map | 1 | 2 | 3 | 4 | 5 | 6 | 7 | 8 | 9 |10 | BNC home | mrbdc home | web site map |