State of the Minnesota River 2000 Surface Water Quality Monitoring
STATE OF THE MINNESOTA RIVEREXECUTIVE SUMMARY SURFACE WATER QUALITY MONITORING 2000 Access the full 2000 State of the Minnesota River Report |
|
| Basin Overview Monitoring Methods Precipitation & Runoff TSS Nitrate-N Phosphorus For More Information |
|
 |
This executive summary provides an overview of the more detailed report entitled: “State of the Minnesota River: Summary of Surface Water Quality Monitoring 2000.” The full report can be accessed on the Minnesota River Basin Data Center website at: http://mrbdc.mnsu.edu. The Minnesota River has been cited as one of the nation’s and state’s most polluted rivers. In response to these pronouncements, considerable attention and support has been given to clean up efforts. In order to determine whether these efforts have been successful, it is necessary to measure their effect on the river’s health. This report, a cooperative venture of multiple state and local organizations, begins the task of assembling water quality data and creating a foundation for gauging progress toward a cleaner Minnesota River. A list of contributors is included on the back page. |
| BASIN OVERVIEW | |
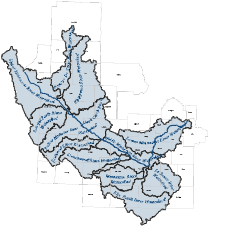 |
The Minnesota River flows more than 335 miles from its source at Big Stone Lake to its confluence with the Mississippi River at Fort Snelling. It winds through diverse landscapes and drains nearly 20 percent of Minnesota (roughly 15,000 square miles). The landscape around the upper reaches is partly forested. As it moves downstream, the river drains primarily agricultural land—some of the state’s richest. The lower reaches are characterized by more densely settled urban landscapes. The basin is subdivided into 13 major watersheds and includes 37 counties. Many water quality challenges relate to land uses—including agricultural runoff and urban point-source discharges. While promising strides have been made to reduce point-source pollutants (like industrial and wastewater treatment plants), managing the array of nonpoint-source inputs marks the challenge ahead. |
| MONITORING | |
|
Monitoring Season |
|
| METHODS | |
The task of collecting water quality data is difficult and complex, and lends itself to a number of different methodologies. Organizations involved in the preparation of this report are moving toward a standard set of methods, a step that will further improve the accuracy of water quality comparisons across the basin. Data analysis involves a number of calculations, all of which are included in the full report. This executive summary uses only one of these calculations, flow weighted mean concentration (FWMC), to describe water quality during the study period. FWMC refers to the concentration (mg/L) of a particular pollutant (e.g. total phosphorus) taking into account the volume of water passing a sampling station over the entire sampling season. It is calculated by dividing the total load (mass) by the total flow. In other words, if all the water passing a monitoring site was put in a large pool, mixed well, and a sample collected, this sample would represent the FWMC. The full report provides a more complete assessment of sediment and nutrient transport including descriptions of loads and yields as well as concentrations. |
|
| PRECIPITATION & RUNOFF | |
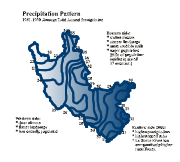 |
Water quality for many pollutants is often linked to precipitation patterns. Due to geographical differences, precipitation patterns vary across the basin (see map). Generally, the precipitation pattern can be characterized as increasing from the western portion of the basin eastward—higher precipitation in the east than west. Typically, the more precipitation that occurs in a watershed, the more runoff there will be. However, factors such as soil type, slope, and land use can affect runoff. Evaluating runoff enables a comparison of the relative amount of water coming out of the individual watersheds. This is relevant because studies have shown a relationship between runoff and the concentration of chemicals of interest. 2000 Runoff Findings There is a strong correlation between runoff and water quality. Total suspended solids, nitrate-nitrogen, and total phosphorus yields are positively correlated with runoff. Trends indicate an increase in runoff volume throughout the 1900s. However, the 2000 monitoring season runoff values were almost all below the 15-year average except the Le Sueur River, which had comparatively higher runoff. The chart at left illustrates these values. |
| TOTAL SUSPENDED SOLIDS (TSS) | |
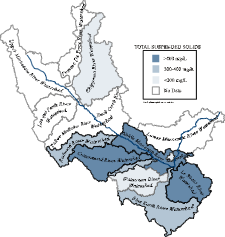 |
Suspended sediment is a major water quality concern (see box below). Sediment concentration, loads, and yields can increase substantially during runoff periods causing wide fluctuations in annual delivery. The amount of sediment that enters and is transported through the streams and rivers of the Minnesota River Basin varies greatly from year to year. For example, the average sediment transport of the Minnesota River at Mankato is about one million tons per year, but it can range from 200,000 to 3.5 million tons per year. Criteria/Standard 2000 TSS Findings |
| NITRATE-NITROGEN (Nitrate-N) | |
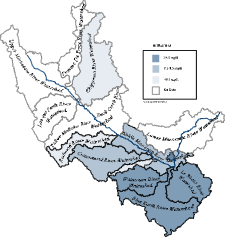 |
Nitrate-nitrogen in the Minnesota River has the potential to impact water quality downstream, particularly contributing to the hypoxia problem in the Gulf of Mexico. Elevated nitrate concentrations in river systems also have the potential to impact water supply wells (see box). Criteria/Standard 2000 Nitrate-N Findings Seven Mile Creek subwatershed had the highest nitrate FWMC of any of the tributary or main stem sites, followed by the Watonwan, Blue Earth, Middle Minnesota, and Le Sueur River Watersheds. |
| PHOSPHORUS | |
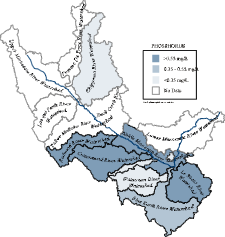 |
Phosphorus has been identified as a major pollutant of the Minnesota River (see box). Elevated phosphorus levels is one of the main reasons the Minnesota River is considered one of the most polluted rivers in the state. Controlling phosphorus is an important part of protecting the river. Criteria/Standard 2000 Phosphorus Findings |
| FOR MORE INFORMATION | |
|
Contributors Contact Information Minnesota Pollution Control Agency Metropolitan Council Environmental Services Minnesota Department of Agriculture University of Minnesota: |
|
|
This page was last updated 12/12/02
|
|
