NITROGEN
RATE DEMONSTRATIONS
Adjusting
Nitrogen Rates for Human Health, Water Quality, and Profits
How
much nitrogen should be applied to a corn crop while at the same time
balancing profit and water quality? Over 15 farmers around St. Peter attempted
to answer that question through a unique three-year study.
Results from the three year study shows the University
recommendations of 120 pounds per acre of N is more than adequate for
maximizing net returns while reducing potential nutrient loss.
Publications
South
Central Minnesota On Farm Nitrogen Rate Trial Results 2000-2005
(pdf 348 k)
Iowa
On Farm Nitrogen Rate Studies - (2000-2003) (pdf 53 k)
Nitrogen Rate Results Article, May 2004
(pdf 33 k)
St.
Peter Wellhead Nitrogen Rate Results, October 2003 (pdf 730 k)
Overview
of the Wellhead Protection Program (Powerpoint presentation 19,439
k)
Project
Overview
Choosing
the right nitrogen rate is always an important decision for area corn
farmers, especially this year when commercial nitrogen (N) prices have
doubled in price compared to last year. Increased environmental concern
over N losses from leaching and water quality makes nitrogen management
even more critical.
Thanks to
new tools, techniques, and local watershed programs, many producers can
now determine their own nitrogen rates instead of relying on general recommendations.
“The use of yield monitors and GPS has added a whole new dimension
to nitrogen management,” states Kevin Kuehner, local watershed coordinator.
“Through on-farm demonstrations, growers can judge for themselves
which rate of nitrogen optimizes their farm’s agronomic, economic,
and environmental performance.”
To initiate each demonstration, a 50-acre portion of a farmer’s
field was selected with soybeans being the previously grown crop. Cooperating
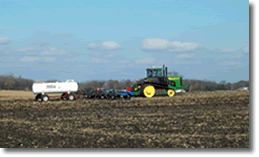
producers then applied nitrogen in 10-acre width strips at five different
application rates of 60, 90, 120, 150, and 180 pounds N per acre. On the
majority of sites a smaller 2.5-acre strip of 0 pounds of applied N was
used as a control. In the fall, the N-Rate plots were then machine harvested
using combines equipped with global positioning enabled yield monitors.
The demonstrations were calibrated and verified by a certified professional
independent crop consultant. The data were then analyzed by Dr. David
Mulla of the University of Minnesota Precision Ag Center to determine
Economically Optimum Nitrogen Rates.
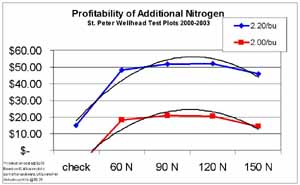
“Farmers have been surprised by the results,” says Kuehner. “Most were especially surprised when some of them found out they could save anywhere between $7-$14/acre by simply lowering their normal N application rates, even during 200+bu./acre years and all while maintaining yields. In just nitrogen alone, this could save area producers $10,000 or more a year in fertilizer costs. They are also surprised that even in the zero-applied N-strips, corn yields still averaged up to 132 bushels/acre,” Kuehner continues.
Dave Mogensen, St. Peter farmer, has participated in the demonstrations for the past five years in the Seven Mile Creek Watershed and St. Peter Wellhead Protection Area. “The N-rate plots have proven to me that we can get by with less N when compared to what we were applying before,” says Dave. “Because of the plot work we have reduced our rates by 20-30 pounds.” Results from the three-year study around St. Peter have shown that Economically Optimum Nitrogen Rates (EONR) ranged from 90-120 lbs. N/acre. The results from the study validated that U of M recommendations of 120 lbs./acre are adequate for area corn farmers and yield goals.
The results are remarkably similar to other plot-work conducted the past two years by Blue Earth Consulting of Lake Crystal. “These results are right in line with what we have found in the Lower Maple River, and Watonwan River watersheds. The more years of data we can get the more confidence farmers will have in the recommendations for cutting back on N-rates,” says Bruce Nowlin, a certified professional independent crop consultant. In that study over 40 farmers scattered throughout South Central MN participated. Results showed that if farmers were applying a common rate of 150 lbs./acre N after soybeans, N-rates could be safely reduced by 10-30 lbs./acre without risking loss of profit. The optimum N-rate in that study was found to be about 111 lbs. N/acre.
The main
goal of these watershed-based projects is to give growers better ways
to address environmental issues without sacrificing the productivity or
prosperity of their operation. It is planned that these farmer-backed,
on-farm demonstrations will continue in future years.
For
More Information
For more information about On-Farm Nitrogen Rate Demonstrations call Kevin
Kuehner, watershed coordinator at (507) 381-9440 or Bruce Nowlin, Blue
Earth Consulting at (507) 947-3362.
Special credit to Blue Earth Consulting of Lake Crystal, University of
Minnesota Precision Agriculture Center, cooperating farmers, crop consultants,
Center for Agricultural Partnerships, Minnesota Clean Water Partnership
Program, and McKnight Foundation. For more information click on the following
links:
http://www.agcenter.org/projects_midwwater.html
http://www.precision.agri.umn.edu/Projects/CAP/index.html
http://www.iasoybeans.com/isa/nconf/NConference.htm
| landowners | educators | site map |
Brown Nicollet Cottonwood Water Quality Board
322 South Minnesota Avenue | St. Peter, MN 56082 | Phone: 507-934-4140 | Fax: 507-934-8958

