
GROUNDWATER
VULNERABILITY PROJECT
A Water Resource Protection Management Tool
Maps
Data
Inputs Nitrate-Nitrogen
Probability
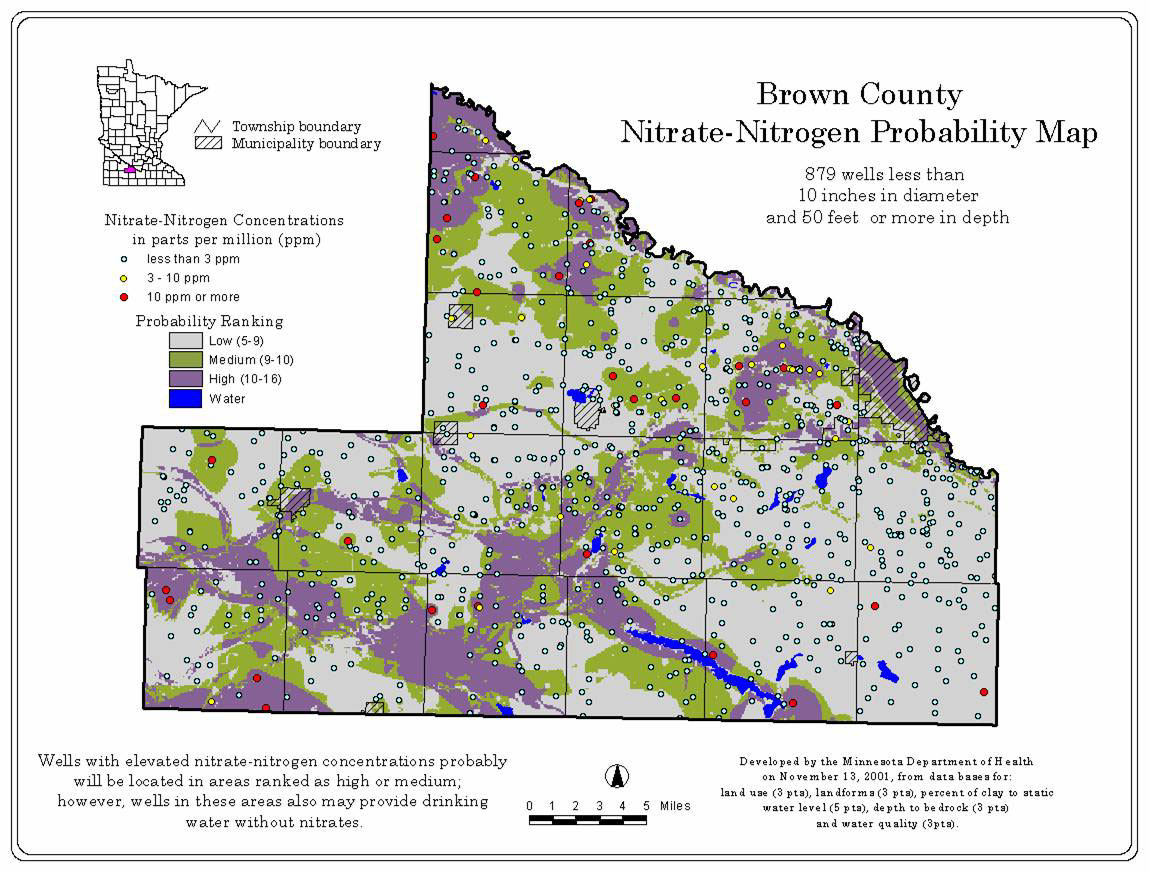
Brown
County Nitrate-Nitrogen Probability
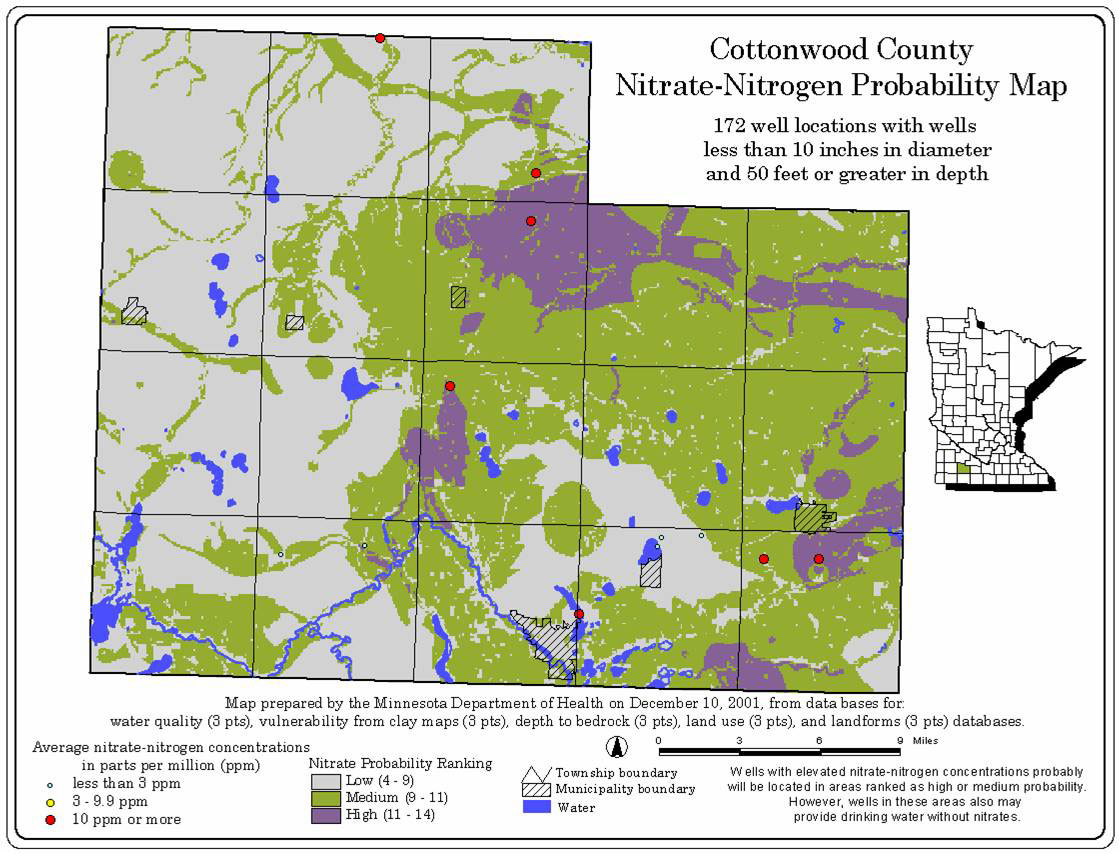
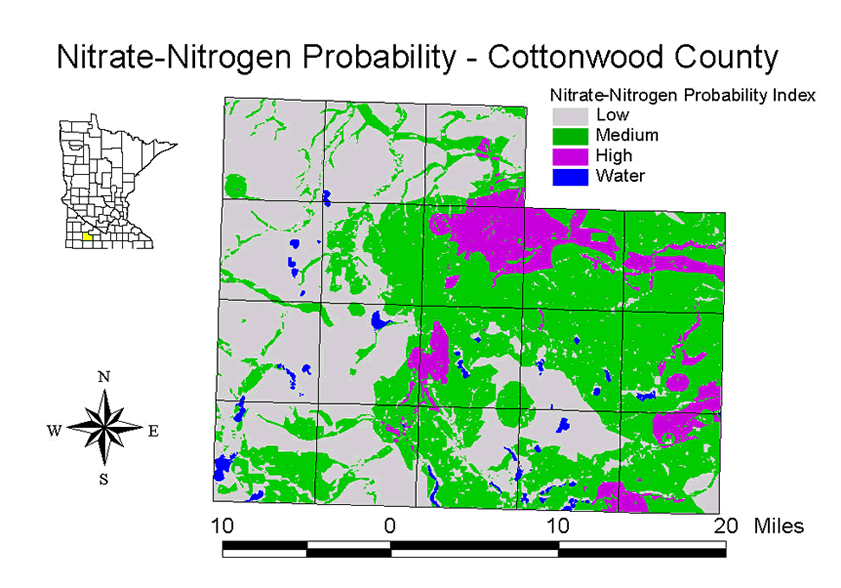
Cottonwood County Nitrate-Nitrogen
Probability
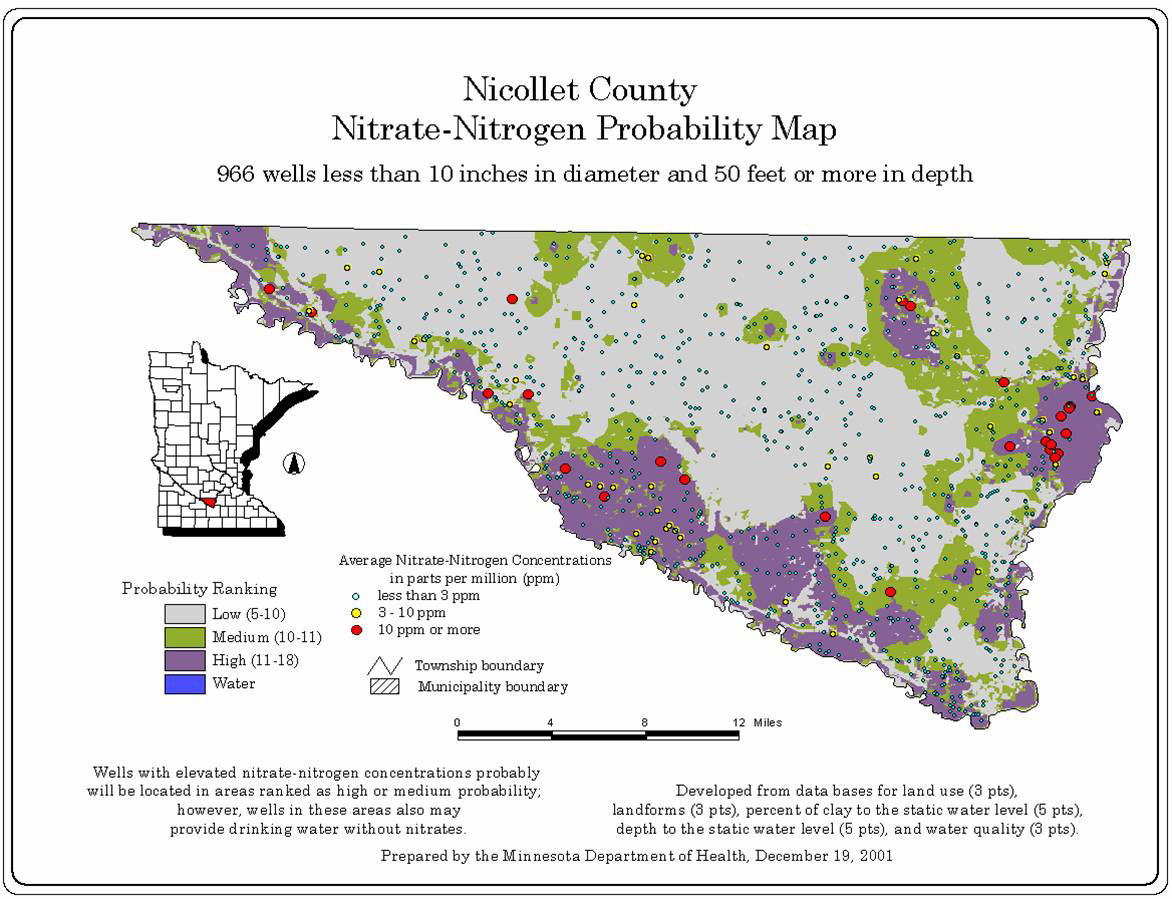
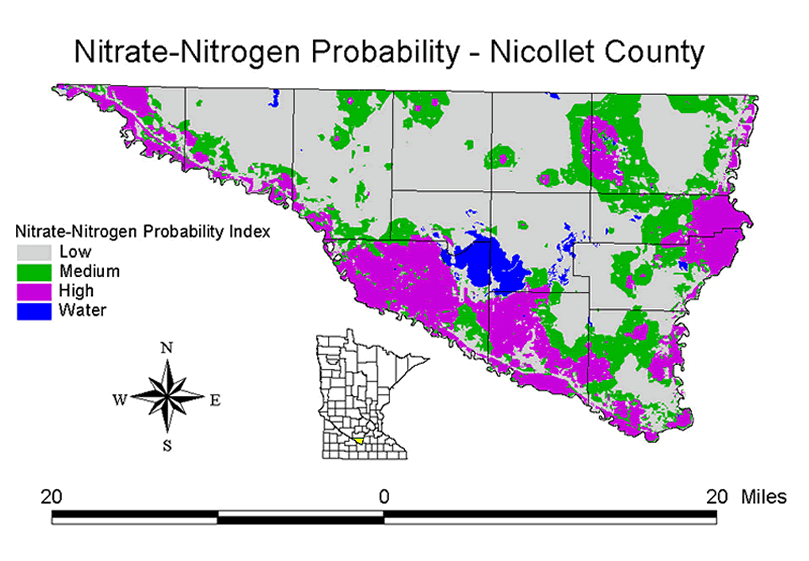
Nicollet County Nitrate-Nitrogen
Probability
Publications
Final
Report: Groundwater Vulnerability Zoning Project, June 2004 (pdf
2,779 k)
Project
Overview
The Groundwater Vulnerability Project is a collaborative effort among
several state and county agencies to map the probability of nitrate contamination
of groundwater in the Minnesota counties of Brown, Nicollet, and Cottonwood.
Why
is Nitrate Contamination a Concern?
Nitrate contamination in drinking water is a serious threat to human health.
Nitrate molecules in the bloodstream prevent the uptake and transportation
of oxygen throughout the body. Nitrates are directly linked to the “blue
baby syndrome,” a serious medical condition in infants who drink
formula mixed with nitrate contaminated drinking water. Since groundwater
is the primary source of drinking water in Brown, Nicollet, and Cottonwood
Counties, it is essential to protect this resource.
Mapping
Potential Nitrate Groundwater Contamination
Several factors determine
the susceptibility of an area to groundwater nitrate contamination, including:
- Geologic formations (the types of rocks that underlie the soil on the surface);
- Geochemical composition (the chemical makeup of the underlying rock); and
- Land use.
Each of these factors affects, to varying degrees, the probability of nitrates occurring in groundwater.
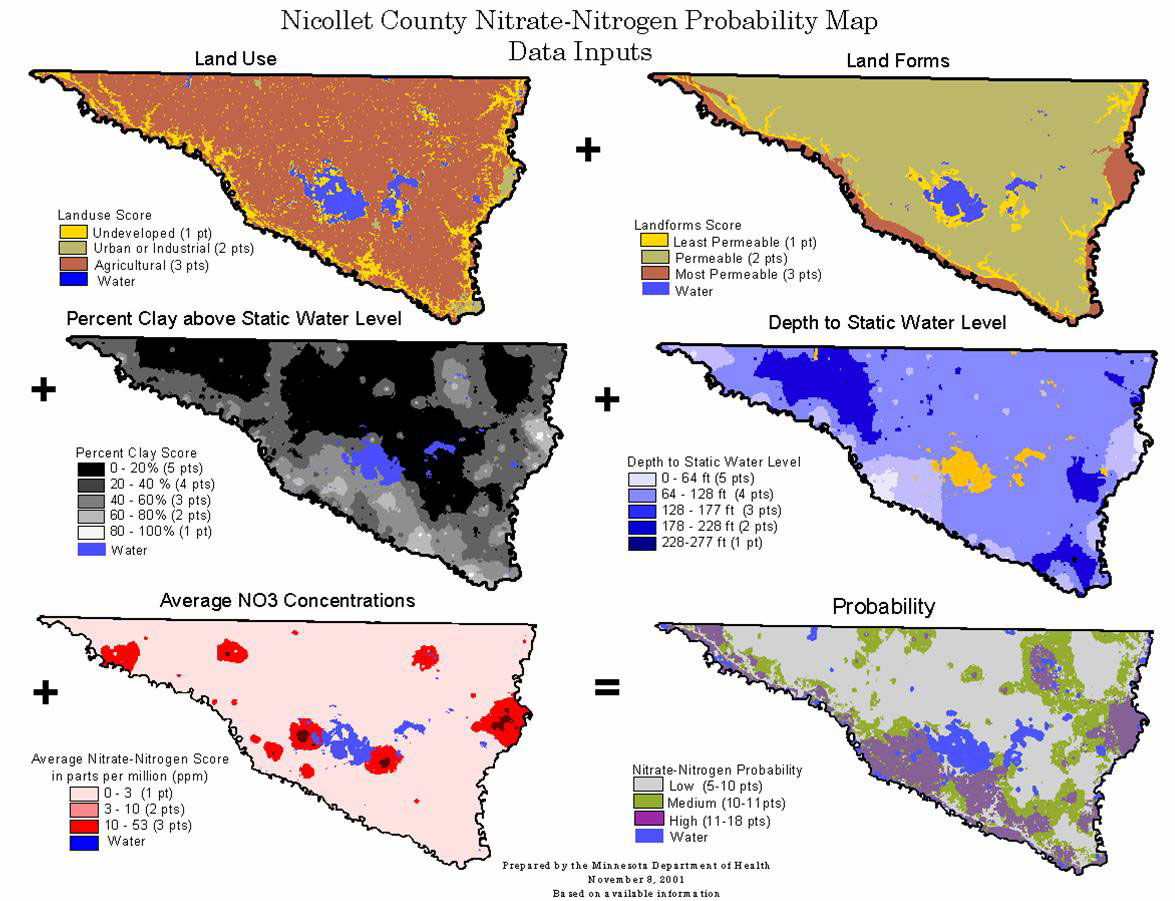
A series of maps were developed and then layered over each other to estimate potentials for nitrate contamination in the groundwater. Maps used included: land use, surface permeability (which is dependent on geologic formations and composition), the percent of clay above the water table, the depth to bedrock, and the water quality and depth to the water table. Then, each category of mapping factor was assigned a different point value. For example, the land use factor was divided into three categories with “Undeveloped” receiving 1 point, “Residential or Commercial” receiving 2 points, and “Agriculture” receiving 3 points. Higher points represent an increased probability for nitrate contamination.
These maps
were then layered over each other to determine an area’s point total
in nitrate-contamination probability. (NOTE: Not ALL wells drilled in
an area of high probability would necessarily have high nitrate concentrations,
but the chances would be greater than they would be in an area of low
probability.)
Who
Provided the Mapping Data?
The nitrate probability
maps are based on extensive databases. County Well Indices (from Brown,
Nicollet and Cottonwood Counties) provided data on clay percentages, depth
to bedrock, and depth to the water table. The Brown-Nicollet Environmental
Health Services produced the water quality database by conducting 10,000
nitrate-concentration analyses of nearly 3,000 wells. The land use database
is based on aerial photography acquired between 1988 and 1990. The Minnesota
Geological Survey provided the landforms database.
How
are the Maps Used?
The nitrate probability maps are used by planning and zoning staff to
identify areas that have a high likelihood for nitrate groundwater contamination.
Sites for permit applications—such as subdivisions or dairy or hog
operations—are identified on the probability maps to determine the
risk of groundwater contamination. The maps are NOT used to deny permits,
but rather to identify vulnerable areas so that appropriate measures can
be added to the permit to protect water quality. This process also educates
applicants about the conditions that contribute to nitrate contamination.
So far, the maps have been applied to more than 30 permit applications.
Future uses of the maps might include targeting areas for wellhead protection
programs and identifying areas that might be susceptible to other contaminants.
A high-quality drinking water supply is in everyone’s interest,
and nitrate probability mapping can help us achieve it.
Partners
- Brown Nicollet Cottonwood Water Quality Board
- Minnesota Department of Health
- Minnesota Pollution Control Agency
- County Agencies: Soil and Water Conservation District, Water Planning, Environmental Health, Environmental Services, Planning and Zoning
- University
of Minnesota County Extension Office
| landowners | educators | site map |
Brown Nicollet Cottonwood Water Quality Board
322 South Minnesota Avenue | St. Peter, MN 56082 | Phone: 507-934-4140 | Fax: 507-934-8958