October 2004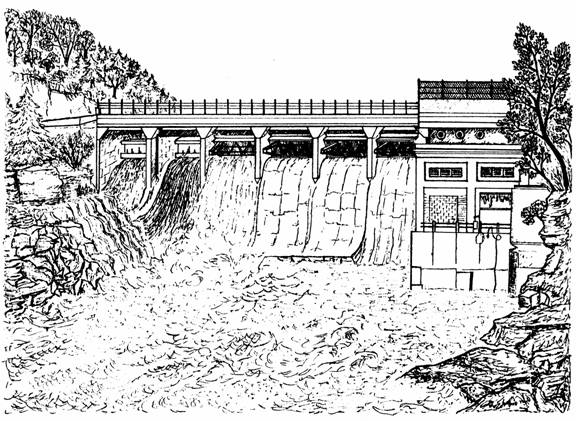
The Rapidan Dam Research Project: Environmental impacts of converting
a run-of-the-river low head hydroelectric dam to a peaking operation.
Download Report
| MINNESOTA RIVER BASIN DATA CENTER |
|
October 2004 |
|
Excerpts from the Executive Summary
The Rapidan Hydroelectric dam was built in 1910-1911 as a stimulus to the growth of Mankato. The dam was severely damaged in the spring flood of 1965 and remained idle as a run-of-the-river dam until 1985. Due to the persistence and enterprising spirit of two men, Blue Earth County Commissioner Bill Maher and Kenneth Lever, Rapidan Redevelopment Ltd. Partnership in combination with the 1973 OPEC Crisis, 1978 PURPA, investment tax credits and appreciated depreciation schedules the dam was retrofitted for peaking. Interestingly, at that time the same debate was going on as to remove, retrofit to peaking, tearing off the top to create a rapids, fill the dam up with concrete, etc. As a part of the dam relicensing, the Minnesota Department of Natural Resources, Minnesota Pollution Control Agency, Blue Earth County, and others required, through stipulation, that the environmental impacts of conversion be examined. Minnesota State University, Mankato at that time, Mankato State University, was contracted to do water quality, sediment, synthetic organics and macroinvertebrate study while MDNR Fisheries did the fish study. It is important to note as stated by Jack Skrypek, ecological manager at that time, in the MDNR’s Division of Fish and Wildlife, that peaking is not a new idea for dams, but there have never been studies of its effects (Weiss, P. 1983). The reservoir itself, during run of the river electric generation, appeared to have some positive and few negatives associated with it for the parameters studied. The positives included the reservoir decreasing the downstream concentration of Total Phosphorous, Filterable Phosphorous, Total Non-Filterable Residue and Total Volatile Non-Filterable Residue as well as Coarse Particulate Organic Matter. Further, the reservoir acted as a sediment trap in the 1984 and 1985 early periods (June-July) with no apparent effects in the late periods (August-September) even though the wet/dry cycle reversed itself. The reservoir acted as a trap for the pthalates (synthetic organics) even during peaking. As a negative the reservoir appeared to increase Nitrate-Nitrogen, which may have been due to the oxidation of Ammonia. Negative impacts from peaking were observed in all four study categories of Water Quality, Sediments, Synthetic Organics and Aquatic Macroinvertebrates. However, most of the impacts were short term, acute and related directly to the peaking cycles. Sedimentation in the reservoir and the below dam aquatic macroinvertebrate changes (as a consequence of acute fluctuations in water quality and quantity) were long term changes. From a water quality perspective, all three sites below the dam revealed higher levels than baseline (June-September) for Organic Nitrogen, Total Phosphorous, Total Non-Filterable Residue and Total Volatile Non-Filterable Residue. The pre-event, startup, to maximum during the three events revealed that in 84 of 91 cases, the events raised the maximum concentration of the parameters; in some cases (i.e. Ammonia) up to 10 times. The Organic Matter in transport increased with events from pre-event in 33 of 36 cases, ranging up to 500 percent. That the increases were often greater progressively downstream implicates rewetting of the river bed, an area requiring further study. The sediment data revealed that the pre-event was surpassed during each event at all sites for suspended sediments. The synthetic organics data (pthalates) showed significant fluctuations at Site 3. The macroinvertebrate component documented significant reductions in total abundance, richness and species diversity downstream of the dam due to peaking. The findings of this study document one of several consequences of conversion to peaking (i.e. also economics of electrical generation, fisheries, etc.) that need to be weighted in the final decision of switching from run of the river to a peaking generation option. The findings also apply to the option of maintaining the dam and reservoir as a run-of-the-river operation. |
| Download Report The Rapidan Dam Research Project report is available as a complete document or is available in sections as listed below. The report may be viewed or printed by choosing from the list of pdf files. Download time increases with file size. Viewing and printing time may be decreased by saving the pdf file to your computer's hard drive. |
Executive Summary ( pdf 2.1 mb ) Complete Report ( pdf 21.4 mb ) Report by section: Cover ( pdf 999 k ) Table of Contents through Introduction ( pdf 79k ) Site Description and Study Area ( pdf 1.1 mb ) Methods ( pdf 144 k ) Results pages 20-37 ( pdf 781 k ) Results pages 38-65 ( pdf 2.3 mb ) Results pages 66-87 ( pdf 3.1 mb ) Results pages 88-114 ( pdf 2.3 mb ) Results pages 115-133 ( pdf 805 k ) Conclusions ( pdf 115 k ) Literature Cited ( pdf 22 k ) Appendix A ( pdf 6.5 mb )
|
This
page created October 16, 2004. Updated
September 7, 2011
. |