PROJECT APPROACH
METHODS
Methods – Lab and Field Measurements
Laboratory Analysis
Minnesota Valley Testing Laboratory – New Ulm, MN
Field Measurements
Recorded at 15 minute intervals
- Flow
- Precipitation
- Tile Water Temperature
- Soil Temperature (4 inch depth)
MONITORING EQUIPMENT
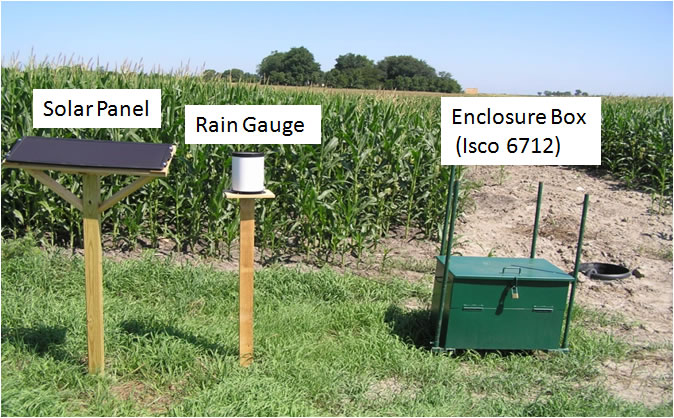
ISCO 6712 automated samplers trigger after the ISCO 750 Area Velocity Flow Module detects an increase in stage or velocity due as a result of storm events.
Variable by site, depending on appropriate conditions.
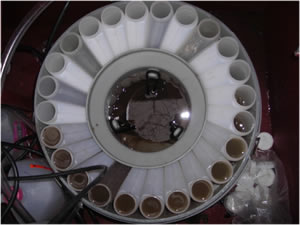
Once activated, the automated sampler collects 1 sample per hour for 24 hours in a 1-liter bottle.
At some sites, the sample rate is set to collect every 2 hours.
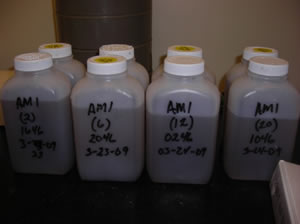
3-6 bottles are collected from the sampler after each event.
Samples are generally chosen to represent the rise, peak and recession of hydrograph.
The majority of samples collected are storm event based.
Grab samples are also collected periodically for baseline data.
- Enclosed steel box to house equipment
- Teledyne ISCO 6712 automated sampler
- 24 polypropylene 1-liter sample bottles
- 3/8 inch vinyl suction line
- ISCO 750 Area Velocity Flow Sensor
- 12 volt marine battery
- Northern Industrial Tool solar panel
- Battery regulator
- Spring clamp (for Area Velocity Sensor insertion into the tile line)
- ISCO 674 Rain Gauge
- ISCO 581 Rapid Transfer Device (for data retrieval)
- Flowlink (version 5.0)
- NexSens waterproof housing with DS1921G micro-T temperature loggers
- ISCO 6712 automated samplers trigger after the ISCO 750 Area Velocity Flow Module detects an increase in stage or velocity due as a result of storm events.
- Variable by site, depending on appropriate conditions
- Once activated, the automated sampler collects 1 sample per hour for 24 hours in a 1-liter bottle.
- At some sites, the sample rate is set to collect every 2 hours.
- 3-6 bottles are collected from the sampler after each event.
- Samples are generally chosen to represent the rise, peak and recession of hydrograph.
- The majority of samples collected are storm event based.
- Grab samples are also collected periodically for baseline data.


