
Population Estimates
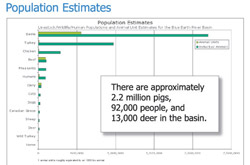
Part of the TMDL process entails estimating the amount of fecal coliform produced in the basin. The first step is to estimate population figures. The graph at left shows population estimates for humans, livestock, wildlife, pets, etc. There are roughly 2.2 million pigs (swine), 92,000 people, and 13,000 deer.

Fecal Coliform Estimates per Individual
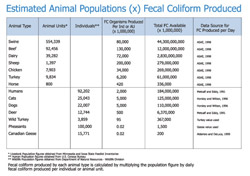
Estimates are made for how much fecal coliform each animal type produces. Multiplying the population figures by the amount of fecal coliform produced daily per animal results in an estimate of the total amount of fecal coliform produced in the basin (see chart below)Fecal coliform produced by each animal type is calculated by multiplying the population figure by daily fecal coliform produced per individual or animal unit.

Amount of Bacteria Produced vs Delivered to Waterways
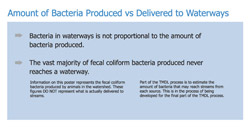
Bacteria in waterways is not proportional to the amount of bacteria produced. The vast majority of fecal coliform bacteria produced never reaches a waterway.
Information on this poster represents the fecal coliform bacteria produced by animals in the watershed. These figures DO NOT represent what is actually delivered to streams.
Part of the TMDL process is to estimate the amount of bacteria that may reach streams from each source. This is in the process of being developed for the final part of the TMDL process.
Minnesota River Basin Data Center | Minnesota State University, Mankato
184 Trafton Science Center S, Mankato, MN 56001 | Phone: (507)389-5492 | FAX: (507)389-5493